PowerShell script to find all IP addresses assigned on a list of Windows Servers

### PowerShell script to find all IP addresses assigned on a list of Windows Servers.
### List all IP addresses assigned in each server, includes IPv6
###############################################################################

$servers = Get-Content “D:\temp\test2.txt”
$reg=””
foreach ($server in $servers)
{
$reg+=$server+ “`t”+([System.Net.Dns]::GetHostAddresses(“$server”) | foreach {echo $_.IPAddressToString})+”`n”
}
$reg > “D:\temp\ping-IPs-1.csv”

PowerShell script to find FQDN and get ping status of Windows Servers

### PowerShell script to find FQDN and get ping status for given list of windows servers
# Servers which we failed to connect to get any info are collected in to a txt file.
### Writing credits : VM ###
###########################################################################

$servers = Get-Content “D:\temp\test2.txt”

@(
foreach ($name in $servers)
{
if ( Test-Connection -ComputerName “$name.domain.com” -Count 1 -ErrorAction SilentlyContinue ) { Write-output “$name.domain.com is up”}
elseif ( Test-Connection -ComputerName “$name.a.domain.com” -Count 1 -ErrorAction SilentlyContinue ) { Write-output “$name.a.domain.com is up”}
elseif ( Test-Connection -ComputerName “$name.b.domain.com” -Count 1 -ErrorAction SilentlyContinue ) { Write-output “$name.b.domain.com is up”}
elseif ( Test-Connection -ComputerName “$name.c.domain.com” -Count 1 -ErrorAction SilentlyContinue ) { Write-output “$name.c.domain.com is up”}
elseif ( Test-Connection -ComputerName “$name.newdomain.com” -Count 1 -ErrorAction SilentlyContinue ) { Write-output “$name.newdomain.com is up”}
#elseif ( Test-Connection -ComputerName “$name” -Count 1 -ErrorAction SilentlyContinue ) { Write-output “$name is up”}
else
{
Write “$name FQDN not found/ server is not pinging” | out-file -Append “D:\temp\failed-ping-1.txt” -NoClobber
}
}
) | Out-file -FilePath “D:\temp\FQDN-1.csv”

PowerShell script to find a server is physical server or virtual machine

### Powershell script gives Manufacturer and Server Model for a given list of servers, and we can find if its a VM or a physical server.
### eg: for a VM, manufacturer will be “VMware, Inc.”, and model will be “VMware Virtual Platform”
### eg: for a physical server, manufacturer will be “HP” (or others), and model will be “ProLiant BL460c G7”
### Servers which we failed to connect to get any info are collected in to a txt file.
### writing credits : VM ###
#######################################################################################

$servers = Get-Content “D:\temp\test2.txt”
$result = @()
$finalresult = @()

foreach ($computer in $servers)
{
$result = Get-WmiObject -Class Win32_ComputerSystem -ComputerName $computer | select pscomputername, manufacturer, model
$finalresult+=$result
if (!$result) { Write “No info on server $computer” | out-file -Append “D:\temp\notfound-phy-vm.txt” -NoClobber }
$computer = $null
$result = $null
}

$finalresult | export-csv “D:\temp\VMphys-1.csv” -NoTypeInformation

PowerShell script to find OS name, Service Pack Version and OS-Architecture (32/64 bit)

### PowerShell script to find OS name, Service Pack Version and OS-Architecture (32/64 bit) for given list of servers
# servers which we failed to connect to get any info are collected in to a txt file
### writing credits : VM ###
#######################################################################################

$servers = Get-Content “D:\temp\test2.txt”
$result = @()
$finalresult = @()

foreach ($srv in $servers)
{
$result = Get-WMIObject Win32_OperatingSystem -ComputerName $srv | Select-Object csname, caption, ServicePackMajorVersion, OSArchitecture
$finalresult+=$result
if (!$result) { Write “No info on server $srv” | out-file -Append “D:\temp\notfound.txt” -NoClobber }
$srv = $null
$result = $null
}

$finalresult | export-csv “D:\temp\OS-outputs.csv” -NoTypeInformation

How To Clean Up C:\Windows\Winsxs

So you’ve been taking a look at what’s eating your hard drive space with WinDirStat or TreeSizeFree or similar and have spotted the C:\Windows\Winsxs folder.

Winsxs stands for Windows Side by Side and is basically where Windows keeps multiple versions of the same .dll’s to allow multiple applications to run without any compatibility problems. If you browse it you’ll see what looks like a lot of duplicate .dll files. I’m not going to go into the in’s and out’s of it here as there are plenty of good run through pages on the web.

What I will do is give you the easy and safe way to clear it down.

From the C:\Windows\System32 folder run:

DISM /online /Cleanup-Image /SpSuperseded


This blog was copied from: http://sysbadmin.wordpress.com/2012/10/14/how-to-clean-up-cwindowswinsxs/


What is IOPS and how to calculate IOPS for an application (Exchange, SQL, Sharepoint,etc.)

What is it and how to calculate IOPS

This question is frequent, mostly because how Dell solutions Consultant that is a hardware manufacturer we know.

What are IOPS?

Is the number of operations per second that an individual disk can arrive. For example, a 10 k SAS disk achieves on average 140 IOPS.

This speed is standard in the industry with variations between models, but we can have a base of what is acceptable and the disk manufacturer can tell you this number.

However, note that the difference is very large, especially taking into account the new SSD drives. For example, the disk Intel x 25-E (See the pdf with the characteristics http://download.intel.com/design/flash/nand/extreme/extreme-sata-ssd-datasheet.pdf) arrives at numbers 30 times larger than the SAS and SATA disks.


model

Because the IOPS is so important?

This question is obvious, but the explanation may not be so simple. It turns out that in most cases we have the tendency to minimize the issue saying it is “performance” or “user perception” but in fact can impact directly on the running of an application, in some cases may even paralyze the application.

For example, an Exchange 2003 environment with 2 thousand mailboxes need 1.5 thousand IOPS and this number is not easy to achieve. The SQL Server database to a SharePoint needs 5 thousand IOPS to work.

How to calculate the IOPS?

Multiply the total number of disks for the RAID type and will get your number. Here some examples:

table

RAID 1, RAID 10 or RAID 0 will give you proportional the largest number of IOPS possible because RAID 5,  the calculation takes into account disk 1 and unless 2 disks RAID 50 unless parities.

How to achieve the highest IOPS possible with greater capacity?

We have three ways to do this:

  1. Use high-performance disks as the 15 k SAS or SSD, but are expensive and in the case of SSD only sizes 32/50/64/100 GB
  2. Use the proper RAID type for the performance and not to the size you want as many today make, which often involves using RAID 10 for total performance rather than RAID 50, we would lose into ability but we gain in performance
  3. Buy a storage that works with virtual LUNs, i.e. it allocates the data on the disks as the need for this given and does not need to say the RAID type

What are virtual LUNs?

Let’s not go into technical point since this is much more complex, but we can understand what is this new technology without becoming experts in storage.

Using the Dell arrays as an example, the MD3200i works with LUNs in the normal way we know. You indicate that the disks X the Y form a RAID 0, Z to W RAID 5 and so on. I.e. we map directly to the disks and are dependent on the ability of each individual IO.

Already in the series EqualLogic we can define the size of the LUN without indicate the disks and storage will automatically allocate more data accessed on disks faster (!!!!). You must be thinking it is joke or something like “concept”, but it is not!!

The new arrays sold by Dell, EMC, IBM and others are smart and allow you to mix the disks. For example, can I put in SSD disks storage drawer and one more additional drawer with 24 SAS 15 k disks and not worry if the LUN created is the disks more performance, who will do this job is storage.

And, the more interesting, when the storage “perceive” that certain data (LUN) is more accessible than another it will relocate to faster disks and make the shift of data without performance loss and intervention, since works in background and automatic!!!!

Interesting references

How to calculate IOPS for Exchange 2003 http://technet.microsoft.com/en-us/library/bb125019 (EXCHG. 65) .aspx

How to calculate IOPS for Exchange 2010 http://technet.microsoft.com/en-us/library/ee832791.aspx

How to calculate IOPS for the SharePoint 2010 and SQL http://technet.microsoft.com/en-us/library/cc298801.aspx

Utility to measure IOPS for SQL Server (SQLIO) http://www.microsoft.com/download/en/details.aspx?displaylang=br&id=20163

References of EqualLogic S6000 http://www.equallogic.com/products/default.aspx?id=9511

This Blog was copied from:
http://msincic.wordpress.com/2011/07/03/what-is-it-and-how-to-calculate-iops-exchange-sql-sharepoint-others/

Five quick windows command prompt tricks


1.    Send any Command’s Output to the Clipboard

Note: This will work for any command.

How many times have you used the ipconfig command only to copy and paste the output?  You will never have to do that again as you can simply send the output directly to the clipboard.

Eg:

         ipconfig | clip


 2.    Open Command Prompt From a Folder

Do you like to open the command prompt and enter endless cd commands trying to get to the correct folder? If the answer is a NO, then you will pleased to know that you can actually save a lot of time by opening a command prompt within a folder from Windows Explorer.

All you have to do is hold SHIFT while right-clicking on a folder and the option “Open command window here” will appear in the context menu.


 3.    Command History

You most likely have been pressing the up key to get to your previous commands, but this can be a pain when you are trying to track down a particular command. One other way you can view your past command is to use the doskey command.

         doskey /history

doskey


 4.    Drag and Drop Files to Change the Current Path

Another neat trick if you are not a fan of opening a command prompt from the context menu is the ability to drag and drop folders onto the prompt and have it automatically enter the path of the folder. You’ll need to type the CD command and then drag the folder over to actually change the path, but you can use the same technique for a lot of different commands.

 5.    Run Multiple Commands In One Go

Our final trick of the day is one that many command line geeks may already know, the ability to run multiple command at once by linking them with double ampersands. You can do this with any commands and you can link up as many as you want. Eg:

         ipconfig /all  && netstat -aon


BONUS: If you want to avoid the IPv6 crap when you run ipconfig, and like to view just the IPv4 addresses, use this:

          ipconfig | find “IPv4”

http://www.howtogeek.com/119386/5-windows-command-prompt-tricks-you-probably-dont-know


VHDX

With Windows Server 2012 Microsoft released a new Virtual Disk Format called VHDX. VHDX improves the Virtual Disk in a lot of way.

Back in October I wrote a blog post on the improvements of the VHDX Format in the Windows Server 8 Developer Preview. Back then VHDX supported a size of 16TB, with the release of the Windows Server 8 Beta (Windows Server 2012 beta) the new Maximum size changed to 64TB.

Some of the VHDX improvements:

  • Support up to 64TB size
  • Supports larger block file size
  • improved performance
  • improved corruption resistance
  • the possibility to add meta data

You can download the VHDX Format Specification.

To use this new features you have to convert your existing VHDs into the new VHDX format. You can this do in two different ways, with the Hyper-V Manager or with Windows PowerShell.

Convert VHD to VHDX via Windows PowerShell

To convert a VHD to a VHDX with Windows PowerShell you can use simple this PowerShell command:

1
 Convert-VHD TestVHD.vhd -VHDFormat VHDX -DestinationPath C:\temp\VHDs\TestVHDX.vhdx -DeleteSource

Of course you can convert the VHDX back to a VHD using the following command:

1
 Convert-VHD TestVHDX.vhdx -VHDFormat VHD -DestinationPath C:\temp\VHDs\TestVHD.vhd -DeleteSource

Convert VHD to VHDX via PowerShell

Convert VHD to VHDX via Hyper-V Manager

  1. Start the Hyper-V Manager and click on “Edit Disk…
    Hyper-V Manager
  2. Now select the VHD you want to convert
    Edit Virtual Hard Disk
  3. Select “Convert
    Convert Virtual Hard Disk
  4. Select the target format in this case VHDX
    Convert VHD to VHDX
  5. Select the new location for your new VHDX
    Convert VHD to VHDX Location
  6. Check the summary and click finish
    Convert VHD to VHDX Finish

Same as with the PowerShell command, you can also convert a VHDX to a VHD. But you have to make sure that the VHDX is not bigger than 2TB.

Aviraj Ajgekar already did a post on this TechNet blog about how you can convert a VHD to VHDX via Hyper-V Manager.

Enable TLS 1.1 and TLS 1.2 on Windows Server 2008 R2 and IIS 7.5 – AdminHorror

Enable TLS 1.1 and TLS 1.2 on Windows Server 2008 R2 and IIS 7.5.

Enable TLS 1.1 and TLS 1.2 on Windows Server 2008 R2 and IIS 7.5

  1. Please backup your registry.
  2. Start the registry editor (regedit)
  3. Browse to the following registry key:
    HKEY_LOCAL_MACHINE\SYSTEM\CurrentControlSet\Control\SecurityProviders\SCHANNEL\Protocols
  4. Add the following keys: 
    TLS 1.1 and TLS 1.2
  5. Within each of the TLS 1.1 and TLS 1.2 keys (they look like folders), add these keys:Client and Server
  6. Within each of the Client and Server keys, create the following DWORD values:
    • DisabledByDefault with a value of 0
    • Enabled with a value of 1
  7. Reboot the server.

You should now have registry settings that look like:
TLS 1.2 Registry Settings

I tested the new settings by configuring Internet Explorer 9 to only use TLS 1.2 and connected to a secure page on one of the websites on my server. Here is where you configure IE9 to do this:
IE9 SSL/TLS Settings

Do your customers a favor (and thus yourself) by allowing them to use a more secure version of SSL/TLS on your website. Configure your IIS server to use TLS 1.1 and TLS 1.2. Hopefully all web browsers will support these versions in the very-near future – but at least Internet Explorer 9 already does.

Event Tracing for Windows: A fresh look at an old tool

Event Tracing for Windows: A fresh look at an old tool

While most Windows developers know of Event Tracing for Windows (ETW) as a logging and tracing mechanism, many administrators have never heard of it. Simply put, ETW includes event logging and tracing capabilities provided by the operating system. Implemented in the kernel, it traces events in user mode applications, the operating system kernel and kernel-mode device drivers.

Event Tracing for Windows is used by a number of core OS components and some third-party applications to provide event logging and tracing. Although it required access to a checked build of Windows to gather ETW information when first released with Windows 2000, more recent versions provide built-in tools with normal (free) Windows builds.

Getting started with Event Tracing for Windows
When diagnosing and troubleshooting Windows Server issues, it seems there is never too much data. The admin is always looking for additional details on what is going on with various components to pinpoint the problem. As such, there are a number of tools like Process Monitor,Process Explorer, Performance Monitor (Perfmon) and Performance Analysis for Logs (PAL) that dig considerably deeper than the event log, but there are times when we need to dig even further down than that.

ETW allows additional instrumentation for gathering data that would not otherwise be available and has a number of advantages. For example:

  • it uses per-processor kernel buffers from a non-paged pool that are not impacted by application crashes or hangs

  • it uses very low CPU overhead

  • it’s available for x86, x64 and IA64 architectures

  • it can enable and disable tracing without rebooting or restarting applications

Event Tracing for Windows may seem like a great tool, but using it is another issue since there is no GUI or user guide. It also requires a few preliminary steps just to produce output that can be used for analysis.

In order to provide useful output you need a consumer. The consumer built in to Windows Server is Tracerpt.exe. As you can imagine, there are a number of flags for Tracerpt to provide specific output formats, so it’s important to become familiar with the Tracerpt and Logman utilities that are native in Windows Server 2003 and up, as well as Windows 7 and Vista.

It’s also important to understand the architecture for ETW. As you can see in Figure 1, the controllers are used to start and stop a tracing session. The tool used to do this in Windows Server 2003 and 2008 is Logman.exe.

Figure 1. The ETW architecture
The ETW architecture
       Image credit: Microsoft Corp.

Windows Server 2003 also contains a handful of event providers that return specific events, including the following Active Directory-related providers:

  • Active Directory: Core
  • Active Directory: Kerberos
  • Active Directory: SAM
  • Active Directory: NetLogon

For instance, specifying Active Directory: Kerberos as a provider will only return Kerberos-specific events.

Event providers differ between Windows versions, however. For example, Windows Server 2003 has 22 providers, while Windows 2008 has 387. This gives more power to the trace and offers more granularities. Yet when it comes to LDAP traffic, the Active Directory: Core provider appears to give the same detail for either Windows version.

You can also combine event providers into a single trace. Since Kerberos authentication was involved in the example above, I used the Active Directory: Kerberos and the Active Directory: Core providers and applied the Logman option-pf, as shown in the following example:

Logman Create Trace CoreKerb –pf c:\etw\input.txt –o c:\etw\coreKerb

The –pf option reads an input text file (input.txt in this case). The format of the input file is shown in Figure 2.

Figure 2. Input text file format
Input text file format

Putting Event Tracing for Windows to work
The best way to explain ETW is with a case study. Recently, I was contacted by an engineer who needed information about how Active Directory was responding to an LDAP request for a Unix client authenticating against an AD domain controller. He used a Unix command to see the bind request/response on the Unix side and wanted to see similar output on the Windows side. The output looked something like this:

[23/Sep/2010:15:04:44 +0200] conn=31 fd=65 slot=65 connection from 10.50.20.173 to 10.50.12.119

[23/Sep/2010:15:04:44 +0200] conn=31 op=0 BIND dn="uid=dorsa,ou=people,o=Corp.net" method=128 version=3

[23/Sep/2010:15:04:44 +0200] conn=31 op=0 RESULT err=0 tag=97 nentries=0 etime=0 dn="uid=dorsa,ou=people,o=corp.net"

[23/Sep/2010:15:04:44 +0200] conn=31 op=1 SRCH base="ou=people,o=hp.com" scope=2 filter="(|(uid=dorsa)(cn=mdilln.dodgcty))" attrs=ALL

[23/Sep/2010:15:04:44 +0200] conn=31 op=1 RESULT err=0 tag=101 nentries=2 etime=0

[23/Sep/2010:15:04:44 +0200] conn=31 op=2 UNBIND

[23/Sep/2010:15:04:44 +0200] conn=31 op=2 fd=65 closed - U1

[23/Sep/2010:15:04:44 +0200] conn=29 op=-1 fd=64 closed error 11 (Resource temporarily unavailable) -

To work through the output, I used the NTDS Diagnostics registry key atHKEY_LOCAL_MACHINE\SYSTEM\CurrentControlSet\Services\NTDS\Diagnostics and defined the LDAP Interface for a value of 5. It only provided the elapsed time of the operation and wasn’t close to the Unix output, so I decided to try Event Tracing for Windows. Since this was on Windows Server 2003, I used the Active Directory: Core provider, which gave LDAP details.

Below are the steps and commands I used to create an ETW trace and generate a log. The commands were used to dump LDAP data during authentication for the Unix engineer. I also created a C:\ETW directory to store all my data.

  1. C:>Logman Query Providers — This command lists all available providers. Note that the provider we are interested in for LDAP information is the Active Directory: Core provider.

  2. Logman create trace “LDAP1” –p “Active Directory: core” –o c:\etw\LDAP1 LDAP1 — This is the name of the trace (we’ll see it when we look at the list of traces).
    • -identifies identifies Active Directory: Core as the provider we want to use.
    • -o specifies the path for the output (.etl) file as C:\etw\ldap1 . The output file will be saved as LDAP1_000001.etl. Note that when the trace runs a second time the output file will be named LDAP1_000002.etl, etc.
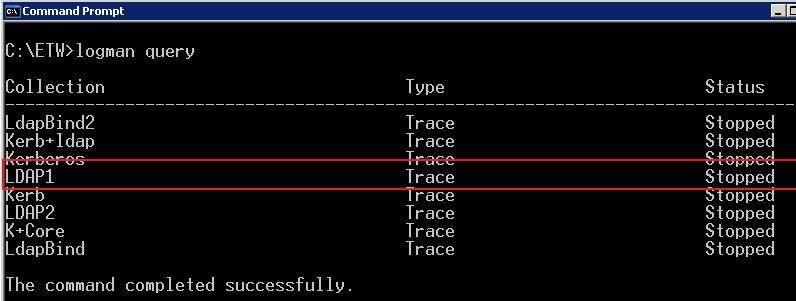
  3. Once the trace is executed successfully with the Logman create trace command it can be seen in the queue with the command: C:>Logman Query. A sample output is shown in Figure 3. The LDAP1 trace is shown in the red box outline in the figure. Note that there are a number of traces I defined which can be reused simply by starting and stopping them.

    Figure 3. ETW trace (click to enlarge)
    ETW trace

  4. The following command starts the trace:

    Logman Start LDAP1

    Issuing Logman Query at this point would show LDAP1 as “Running”.

  5. Reproduction operations are then needed to reproduce the problem or situation you want to trace. In this case, I performed a logon and ran some LDIFDE commands to perform LDAP searches. Having these commands ready as soon as the trace starts will minimize the noise in the trace and make it easier to read.

  6. Next, stop the trace: Logman Stop LDAP1

  7. The C:\ETW directory now shows that the LDAP1 trace file LDAP1_000002.etl was created:

    C:\ETW>dir ldap1*
    Volume in drive C has no label.
    Volume Serial Number is 309D-BA04

    Directory of C:\ETW

    10/13/2010 04:22 PM     1,015 ldap1
    10/13/2010 04:20 PM     262,144 LDAP1_000001.etl
    01/21/2011 02:12 AM     262,144 LDAP1_000002.etl

  8. Because this is the second time running that trace, the file name was bumped to 000002.

Since the .etl log is unreadable we can use Tracerpt to give us some useful data. The command for this example would be:

TRACERPT LDAP1_000001.etl -o Ldap1.csv

    • -of sets the file type (default CSV) (See online help for more formats.)
    • -o represents the output file name default, which is dumpfile.csv and produces the most interesting dump of LDAP activity
    • -Summary, -Report represents statistical data (not used in this example)

Opening the LDAP1.csv file in Excel (or Notepad) will allow a look at the data. Figure 4 shows part of my output file with the LDAP requests and responses highlighted. As you can see, the search and bind requests from the text are in column A, while in column B you can see the start and end of the requests, which can be paired up. Further to the right you can see the user data, the filter and scope of the LDAP request, and so on.

Figure 4. View of LDAP1.csv data (click to enlarge)
View of LDAP1.csv data

The exciting thing about Event Tracing for Windows is that the opportunities with providers seem endless. Providers for Group Policy, Kerberos, LDAP clients, Netlogon, FSRM, IIS and many more are all available in Windows Server 2008.

While I used to rely exclusively on event logs and similar log files, I can now go a level deeper with Event Tracing for Windows and get a lot more verbose data to help me solve whatever problem I’m troubleshooting. The commands to produce the traces and reports are very easy to use as well. Of course, you can find more command options and details online.

You can follow SearchWindowsServer.com on Twitter @WindowsTT.

ABOUT THE AUTHOR
Gary Olsen is a systems software engineer for Hewlett-Packard in Global Solutions Engineering. He authored Windows 2000: Active Directory Design and Deployment and co-authored Windows Server 2003 on HP ProLiant Servers. Gary is a Microsoft MVP for Directory Services and formerly for Windows File Systems.