Realtime scenario: Windows 2003 server with two NICs in Mgmt and Dev networks started routing traffic via the Mgmt network

Realtime scenario:

We have Windows 2003 server which had two NICs, one each in a Mgmt network and Dev Zone network. This was essentially a Development server, and we used to connect to this server using the Dev Zone IP.

For some reason, its started acting up. When we connect the network cable to the management NIC on the server, the whole traffic started to route via the management network hence we were unable to connect to the server.

We tried changing the order of the NICs from Network Connections (ncpa.cpl) -> Advanced Menu -> Advanced Settings. This did not work.

So we changed the static routing from management IP to Development IP, as our network team suggested.

We reconfigure the routing as explained in a TechNet article below:


Add a static IP route

Updated: January 21, 2005

Applies To: Windows Server 2003, Windows Server 2003 R2, Windows Server 2003 with SP1, Windows Server 2003 with SP2

To add a static IP route

  1. Open Command Prompt.
  2. At the command prompt, type: 

    route adddestinationmasksubnetmaskgatewaymetriccostmetricifinterface

    where:


Static IP route entry Definition

destination

Specifies either an IP address or host name for the network or host.

subnetmask

Specifies a subnet mask to be associated with this route entry. If subnetmask is not specified, 255.255.255.255 is used.

gateway

Specifies either an IP address or host name for the gateway or router to use when forwarding.

costmetric

Assigns an integer cost metric (ranging from 1 through 9,999) to be used in calculating the fastest, most reliable, and/or least expensive routes. If costmetric is not specified, 1 is used.

interface

Specifies the interface to be used for the route that uses the interface number. If an interface is not specified, the interface to be used for the route is determined from the gateway IP address.

  1. For example, to add a static route to the 10.0.0.0 network that uses a subnet mask of 255.0.0.0, a gateway of 192.168.0.1, and a cost metric of 2, you type the following at a command prompt:

    route add 10.0.0.0 mask 255.0.0.0 192.168.0.1 metric 2

Notes

  • To open a command prompt, click Start, point to All programs, point to Accessories, and then click Command prompt
  • To make a static route persistent, you can either enter route add commands in a batch file that is run during system startup or use the -p option when adding routes.
  • Routes added by using the -p option are stored in the registry under the following key: 

    HKEY_LOCAL_MACHINE\SYSTEM\CurrentControlSet\Services\Tcpip \Parameters\PersistentRoutes

  • All symbolic names used for destination or gateway are looked up in the network and computer name database files (Networks and Hosts), which are stored in the local systemroot\System32\Drivers\Etc folder.
  • If a route addition fails, you can use the tracert command to verify that the gateway specified is directly reachable from the same subnet as this computer.

Troubleshooting Windows Server 2008 R2 Service Startup Issues (Part 1 and Part 2)

This article discusses the basics of troubleshooting failed system services, including verifying an error message and tracking down information in the event logs.

If you would like read the next part of this article series please go to Troubleshooting Windows Server 2008 R2 Service Startup Issues (Part 2).

Introduction

Troubleshooting a service failure can sometimes be a frustrating experience. Thankfully, there are some techniques that you can use to get to the cause of the problem and get your server up and running relatively quickly. In this article, I want to discuss various techniques that you can use to troubleshoot service failures.

Before I Begin

Before I get started, I just want to quickly mention that all of the screen shots presented in this article series are based on Windows Server 2008 R2. Even so, most of these techniques will work on other versions of Windows as well. The exact steps may not always match up perfectly from one operating system to another, but the basic concepts are relevant across the board.

Verify the Failure

Even though it sounds silly, the very first thing that you should do when you see an error message sighting a service failure is to verify that the error is accurate. I have seen several real world examples of buggy application of the report service failures when the services is actually running. Likewise, it is very common to see an error message when Windows is booted indicating that one or more services have failed to start. This message is often erroneous.

To verify a service failure, you need to open the Service Control Manager by selecting the Services command from the Administrative Tools menu. The Service Control Manager lists every service that is installed on the machine, as well as the services current state. You can see with the Service Control Manager looks like in Figure A.


Figure A: The Services console displays all of the system services.

If the error message that you have received relates to a specific service then you can simply locate the service within the Service Control Manager (services are arranged alphabetically) and check to see whether or not the service is started. If on the other hand you have received a generic error message stating that one or more services failed to start then you need to look to find out whether or not the services that should be running really are.

As you look at the figure above, you might notice that not all of the services are running. This is normal and has to do with the service’s startup type. Windows offers four different startup types for services (some of the older versions of Windows only use three startup types). These include:

Automatic – Services with a startup type of Automatic should start automatically when Windows is booted.

Automatic (Delayed Start) – Automatic services that are configured with the delayed start wait until all of the other automatic services have started before they begin initializing. Even at that, automatic services that use a delayed start use a low priority thread to ensure that the server remains responsive while the services are starting.

Manual – Services that are configured to start manually do not start unless they are instructed to do so either by you, by the operating system, or by an application.

Disabled – If a service is disabled it will not start even if you attempt to manually start the service. Some services are disabled for security reasons, but there are also documented instances of malware disabling system services in order to prevent them from running. If you need to start a disabled service, you can do so by changing the startup type to either Manual or Automatic (or Automatic Delayed Start) and then starting the service.

If you are trying to determine whether or not the necessary services are running, then simply scroll through the list of services and make sure that every service that has a startup type of Automatic or Automatic Delayed Start is running. If a service is configured to run automatically, but is not started the mess services likely the cause of the error.

Manually Start the Service

If you notice that a service that should be running is not running, then the first thing that you should do is to attempt to manually start the service. To do so, just right click on the service and choose the Start command from the resulting shortcut menu. Often times, the service will start without any problems.

Check the Event Log

So what you do if you attempt to manually start a system service, but it does not start? The first thing that I recommend doing in such situations is to check the Event Viewer. In most cases when a service fails to start, one or more event log entries will be created. These log entries can be invaluable in helping you to determine the root cause of the problem.

The location in which the event log entry is created really depends on the type of service that you are having trouble with. There are three main event logs that could potentially contain information about the service that you’re having trouble with. These include:

  • The System Log space – The System Log contains events related to the Windows operating system. If you are having trouble starting a service related to the Windows Operating System then the System Log is the best place to look for information.
  • The Applications and Services Logs space – Newer versions of Windows include a set of logs known as the Application and Services Logs. These logs are application specific. In other words, if you are looking for log entries related to a certain application, then this is the first place that you should look. The Applications and Services Logs container contains dedicated logs for things like Internet Explorer, Microsoft Office, and Windows PowerShell.
  • The Application Log space – most applications do not create a dedicated logs beneath the Applications and Services Logs container. Instead, application related logging information is usually written to the Application log.

Even though the event logs can be a valuable resource for troubleshooting a service that fails to start, it can sometimes be tough to find the information that you are looking for. After all, there are typically thousands of event log entries scattered across a dozen or more logs. If you have trouble locating information related to the service that you are having trouble with, then I recommend using the Event Viewer’s Find feature (which is located in the Actions pane). The Find feature works like a search engine and allows you to search for text related to the problem that you are having, as shown in Figure B.


Figure B: You can search the event logs for specific text.

When you find a log entry related to your problem, just double-click on the entry to view it. Sometimes the log entry will tell you exactly what the problem is. For example, the log entry shown in Figure C indicates that the service was disabled. This problem is easy enough to fix by re-enabling the service. Sometimes however, the solution is not quite so clear-cut. In these situations it is sometimes useful to make note of the event ID number so that you can look it up on the Internet if necessary. Often times, Microsoft provides TechNet articles with comprehensive solutions for specific event IDs.


Figure C: Sometimes event log entries will tell you exactly why a service failed to start.

Conclusion

Now that I have talked about the basics of troubleshooting a stubborn service, I want to move on to some of the more intermediate and advanced troubleshooting techniques. I will discuss these techniques in Part two.


This article discusses five more methods that you can use to diagnose and repair service startup issues.

Introduction

In my first article in this series I talked about some really basic techniques for troubleshooting problems with services that refuse to start. In this article, I want to conclude the series by talking about five more things that you can do to get a stubborn service to start.

Check the Dependency Services

Sometimes a service may fail to start due to a problem with a dependency. Services can sometimes form a hierarchical architecture in which other services must be running in order for a service to start. Granted, not all services have dependencies associated with them, but dependency services are common enough that they certainly warrant a look if you are having trouble starting a service.

In the old days it was really tough to track down problems with dependency services, but most of the newer versions of Windows make it easy. To check service dependencies, open the Service Control Manager, right click on the service that you are having trouble starting, and select the Properties command from the resulting shortcut menu. When you do, Windows will display the service’s properties sheet.

As you can see in Figure A, this properties sheet contains a Dependencies tab. The Dependencies tab is divided into two sections. The top portion lists the services that must be running in order for the service that you have selected to start. The bottom portion of the tab lists services that cannot be started until the selected service is running. In this particular screen capture you can see that the Windows Firewall service cannot start unless the Base Filtering Engine and the Windows Firewall Authorization Driver have started. You can also see that there are no services that directly depend on the Windows Firewall service.


Figure A: Sometimes the failure of a dependency service may prevent a service from starting.

One thing that is important to keep in mind as you troubleshoot service dependencies is that sometimes the dependencies can form a multilevel hierarchy. If you look back at the figure above, you will notice that there is a plus sign to the left of the listings for the Base Filtering Engine service and the Windows Firewall Authorization Driver service. If you click on these icons then Windows will list any other dependencies that exist within the service hierarchy. As you can see in Figure B, there are multiple dependencies for the Base Filtering Engine service, but no additional dependencies for the Windows Firewall Authorization Driver service.


Figure B: Services can have several levels of dependencies.

Check for Authentication Failures

Services can also fail to start as a result of authentication failures. Most services do not run under the context of the user that is currently logged in. If they did then services would be unable to run in the background while no one is logged in. Likewise, services often require special permissions that are beyond those assigned to standard user accounts. As such, every service is linked to an account that provides the necessary permissions for the service to run.

You can see which account is linked to a service by opening the Service Control Manager, right clicking on the service that you are having trouble with, and choosing the Properties command from the resulting shortcut menu. When you do, Windows will display the properties sheet for the service. You can see which account is in use by going to the Log On tab, shown in Figure C.


Figure C: The Log On tab allows you to specify the account used by the service.

As you can see in the figure, Windows gives you the option of running the service using the Local System account or a specific account. In this particular case, an account called Local Service is being used. In case you are wondering, the Local System account is a very high level account that is used only when the service in question needs to act as a part of the operating system. In contrast, the Local Service account has rights that are more similar to those of a standard user. On occasion you might also see a service configured to use the Network Service account. The Network Service account uses the credentials associated with the machine’s computer account.

Normally if a service is configured to use the Local System, Local Service, or Network Service account then you won’t have to worry about managing the credentials for that service. Windows takes care of this automatically on your behalf (assuming that nothing is broken within the operating system). What can be a problem however, is that some services run under the context of either a local user account or a domain user account. When such service accounts are used, passwords can and sometimes do expire.

When a service account password expires, the problem might not be noticed immediately. However, the next time that the machine is rebooted the service which has been assigned an expired password will fail to start. You can fix the problem by going to the service’s Log On tab and manually specifying the new password.

Keep in mind that a service can fail to authenticate even if the password is correct if the machine in question is unable to communicate with the domain controller on which the service account resides.

Malware Infestation

Certain types of malware infestations can cause system services to fail to start. For example, some antivirus products run as system services. If a virus wants to avoid detection then it may check for the existence of such a service, shut the service down, and then damage the system in a way that prevents the service from being started in the future.

Although antivirus related services are by far the most common target, they are certainly not the only type of service that can be attacked by a virus. Viruses can attack virtually any system service. For example, I once saw a virus that attacked the Windows Firewall Service.

Disk corruption

If you are having trouble getting a service to start then another thing that I recommend doing is checking the system for hard disk corruption. I once ran into a situation in which a system seemed to be perfectly healthy aside from the inability of one particular service to start. No matter what I tried I just could not get this service running. Out of desperation I ran the CHKDSK. Upon doing so, I discovered that the system volume was corrupt and that several operating system files had been damaged.

Unfortunately, CHKDSK was unable to fix the problem. I was however able to make a list of the files that have been damaged and then copy those files from another system that was running the same version of Windows (and the same set of patches).

Time Sync Issues

If all else fails, check the system clock and make sure that the time matches the time that is displayed on your domain controllers. If a service uses the Kerberos protocol for authentication then the authentication process can fail if the computer’s clock falls out of sync with the clocks on your domain controllers. In order for Kerberos to function properly, clocks cannot be out of sync by more than five minutes.

Conclusion

As you can see, there are any number of potential causes for service failures. Fortunately, it is usually relatively easy to get a failed service running again using the steps that I have described in this article series. If you have trouble getting a service running, don’t forget that the Event Viewer may contain valuable clues as to the nature of the problem.


If you would like to read the first part in this article series please go to Troubleshooting Windows Server 2008 R2 Service Startup Issues (Part 1).


Tools and Procedures Used to Troubleshoot Windows Firewall – TechNet


Tools and Procedures Used to Troubleshoot Windows Firewall


Applies To: Windows 7, Windows Server 2008, Windows Server 2008 R2, Windows Vista

Using Monitoring in Windows Firewall with Advanced Security

Updated: December 6, 2011

Applies To: Windows 7, Windows Server 2008 R2

The first step you typically take in troubleshooting a Windows Firewall or IPsec problem is to view which rules are currently being applied to the computer. Using the Monitoring node in Windows Firewall with Advanced Security enables you to see the rules currently being applied both locally and by Group Policy.

  1. In the Windows Firewall with Advanced Security MMC snap-in, in the navigation tree, select and then expand Monitoring.

  2. In the navigation tree, select Firewall to view the currently active inbound and outbound rules. You can double-click a rule to view its details.

  3. In the navigation tree, select Connection Security Rules to view the currently active connection security rules that implement IPsec requirements on network traffic. You can double-click a rule to view its details.

  4. For either Firewall or Connection Security Rules, you can determine where a rule came from. In the Actions pane, clickView, and then click Add/Remove Columns. In the Available columns list, select Rule Source, click Add, position it in theDisplayed columns list by clicking Move Up or Move Down, and then click OK. It can take a few seconds for the list to appear with the new information.

  5. In the navigation tree, expand Security Associations, and then select either Main Mode or Quick Mode to view the currently active security associations that are established between the local computer and various remote computers.

  • Only one firewall rule is used to determine if a network packet is allowed or dropped. If the network packet matches multiple rules, then the rule that is used is selected using the following precedence:
    • Rules that specify the action Allow if Secure and also the option Block Override
    • Rules that specify the action Block
    • Rules that specify the action Allow
  • Only currently active rules are displayed in the Monitoring node. Rules might not appear in the list if:
    • The rule is disabled.
    • If the default inbound or outbound firewall behavior is configured to allow traffic that is not blocked by a rule, then allow rules of the specified direction are not displayed.
  • By default, the firewall rules in the groups identified in the following list are enabled. Additional rules might be enabled when you install certain Windows Features or programs.
    • Core Networking – all profiles
    • Remote Assistance – DCOM and RA Server TCP rules for domain profile only, other rules for both domain and private profiles
    • Network Discovery – private profile only

Viewing Firewall and IPsec Events in Event Viewer

Updated: February 18, 2010

Applies To: Windows 7, Windows Server 2008 R2

noteNote
This topic applies to computers that are running Windows 7 and Windows Server 2008 R2 only. To view firewall and IPsec events on computers that are running previous versions of Windows, see Enabling Audit Events for Windows Firewall with Advanced Security


Windows 7 and Windows Server 2008 R2 automatically log significant firewall and IPsec events in the computer’s event log. You can view events in the log by using Event Viewer.

To view events for Windows Firewall with Advanced Security in Event Viewer

  1. Event Viewer is available as part of Computer Management. Click Start, right-click Computer, and then click Manage. UnderSystem Tools, click Event Viewer.

  2. In the navigation tree, expand Event Viewer, expand Applications and Services, expand Microsoft, expand Windows, and then expand Windows Firewall with Advanced Security.

  3. There are four views of operational events provided:

    • ConnectionSecurity. This log maintains events that relate to the configuration of IPsec rules and settings. For example, when a connection security rule is added or removed or the settings of IPsec are modified, an event is added here.
    • ConnectionSecurityVerbose. This log maintains events that relate to the operational state of the IPsec engine. For example, when a connection security rule become active or when crypto sets are added or removed, an event is added here. This log is disabled by default. To enable this log, right-click ConnectionSecurityVerbose, and then click Enable Log.
    • Firewall. This log maintains events that relate to the configuration of Windows Firewall. For example, when a rule is added, removed, or modified, or when a network interface changes its profile, an event is added here.
    • FirewallVerbose. This log maintains events that relate to the operational state of the firewall. For example, when a firewall rule become active, or when the settings of a profile are changed, an event is added here. This log is disabled by default. To enable this log, right-click FirewallVerbose, and then click Enable Log.
  4. Each event includes a General tab that summarizes the information contained in the event. For more information about an event, click Event Log Online Help to open a web page in the Windows Server Technical Library that contains detailed information and prescriptive guidance.

    The event also includes a Details tab that displays the raw data associated with the event. You can copy and paste the information in the Details tab by selecting the text (CTRL+A selects it all) and then pressing CTRL-C.


Enabling Audit Events for Windows Firewall with Advanced Security

Updated: February 18, 2010

Applies To: Windows 7, Windows Server 2008 R2

ImportantImportant
The information in this topic is useful mainly to computers that are running Microsoft® Windows Vista® and Windows Server® 2008. Although the audit events are available in Windows® 7 or Windows Server® 2008 R2, it is more effective to use the operational event logging supported by those versions of Windows. For more information, see Viewing Firewall and IPsec Events in Event Viewer.


By default, Windows Firewall with Advanced Security in Windows Vista and Windows Server 2008 does not log anything in the Event Viewer log. The events that can be logged by Windows Firewall with Advanced Security are called “audit” events, and must be enabled. Once enabled, the events generated by Windows Firewall with Advanced Security can be viewed in Event Viewer.

For more information about events that are generated by Windows Firewall with Advanced Security, see Event IDs Used by Windows Firewall with Advanced Security

Enable audit events for Windows Firewall with Advanced Security

To enable audit events, use auditpol.exe, a command-line tool that modifies audit polices of the local computer. You can use the auditpol command-line tool to enable or disable the various categories and subcategories of events and then view the events in the Event Viewer snap-in.

  • To get the list of event categories recognized by the auditpol tool, type the following at the command prompt: 

    auditpol.exe /list /category

  • To get the list of subcategories under a category (this example uses the category Policy Change), type the following at the command prompt:

    auditpol.exe /list /category:”Policy Change”

  • To set a category and a subcategory to enable, type the following at the command prompt:

    auditpol.exe /set /category:”CategoryName” /SubCategory:”SubcategoryName

An example of setting a category and subcategory to enable is:

auditpol.exe /set /category:”Policy Change” /subcategory:”MPSSVC rule-level Policy Change” /success:enable /failure:enable

The events generated by Windows Firewall with Advanced Security span several categories and subcategories. Consider creating a batch file with the auditpol commands that you want that you can use to enable and disable audit events as needed. The following table lists event categories and subcategories that are relevant to troubleshooting Windows Firewall with Advanced Security.


Category Subcategories

Policy Change

  • MPSSVC rule-level policy change
  • Filtering Platform policy change

Logon/Logoff

  • IPsec Main Mode
  • IPsec Quick Mode 
  • IPsec Extended Mode 

System

  • IPsec Driver
  • Other system events 

Object Access

  • Filtering Platform packet drop 
  • Filtering Platform connection 

When you change audit policy settings, for changes to take effect, you must either restart the computer or force a manual policy refresh. You can force a manual refresh by typing the following command at the command prompt:

gpupdate /force

After you are done troubleshooting, you can disable the events by changing the enable settings above to disable and rerunning the commands.

Viewing firewall and IPsec audit events in Event Viewer

Once the audit events are enabled, use Event Viewer to view the events in the Security event log.

To view firewall and IPsec audit events in Event Viewer

  1. Click Start, click Control Panel, click System and Maintenance (on Windows Vista and Windows Server 2008) or System and Security (on Windows 7 and Windows Server 2008 R2), and then under Administrative Tools click View event logs.

  2. In Event Viewer, expand Windows Logs and then click Security. In the details pane, you can view the security-related audit events. The list of logged events is displayed at the top of the details pane. Clicking an event in the list displays more detailed information in the bottom of the Details pane. The General tab gives a description of the event in friendly text. The Details tab gives you the option to view the details of the event in either Friendly View or XML View. If you need more information about an event, on the General tab, click Event Log Online Help.


Configuring Firewall Log Files

1 out of 6 rated this helpful – Rate this topic

Updated: February 18, 2010

Applies To: Windows 7, Windows Server 2008 R2

You can enable logging in Windows Firewall with Advanced Security to create a text file that contains information about which network connections the firewall allows and drops. You can create the following types of log files:

Configure the firewall log file for a profile

Before you can view firewall logs, you must configure Windows Firewall with Advanced Security to create log files.

To configure logging for a Windows Firewall with Advanced Security profile

  1. In the console tree of the Windows Firewall with Advanced Security snap-in, click Windows Firewall with Advanced Security, and then click Properties in the Actions pane.

  2. Click the tab of the profile for which you want to configure logging (Domain, Private, or Public), and then click Customize.

  3. Specify a name and location.

  4. Specify a log file size limit (Between 1 and 32767 Kbytes).

  5. Click Yes for Log dropped packets.

  6. Click Yes for Log successful connections and then click OK.


To view the firewall log file

Open Explorer to the path and filename you chose in the previous procedure, “To configure logging for a profile”. To access the firewall log, you must be an administrator of the local computer.Windows Firewall with Advanced Security

You can view the log file in Notepad or any program that can open a text file.


Interpreting the firewall log file

The following log information is collected. Some data in the log file applies to only certain protocols (TCP flags, ICMP type and code, etc.), and some data applies only to dropped packets (size).


Fields Description Example

Date

Displays the year, month, and day that the recorded transaction occurred. Dates are recorded in the format YYYY-MM-DD, where YYYY is the year, MM is the month, and DD is the day.

2006-3-27

Time

Displays the hour, minute, and second when the recorded transaction occurred. Times are recorded in the format: HH:MM:SS, where HH is the hour in 24-hour format, MM is the minute, and SS is the second.

21:36:59

Action

Indicates the operation that was observed by the firewall. The actions available to the firewall are OPEN, CLOSE, DROP, and INFO-EVENTS-LOST. An INFO-EVENTS-LOST action indicates the number of events that occurred but that were not recorded in the log.

OPEN

Protocol

Displays the protocol that was used for the communication. A protocol entry can also be a number for packets that are not using TCP, UDP, or ICMP.

TCP

src-ip

Displays the IP address of the sending computer.

XXX.XXX.X.XX

dst-ip

Displays the IP address of the destination computer.

XXX.XXX.X.XX

src-port

Displays the source port number of the sending computer. A src-port entry is recorded in the form of a whole number, between 1 and 65,535. Only TCP and UDP display a valid src-port entry. All other protocols display a src-port entry of -.

4039

dst-port

Displays the port number of the destination computer. A dst-port entry is recorded in the form of a whole number, between 1 and 65,535. Only TCP and UDP display a valid dst-port entry. All other protocols display a dst-port entry of -.

53

size

Displays the packet size in bytes.

tcpflags

Displays the TCP control flags that are found in the TCP header of an IP packet:

  • Ack. Acknowledgment field significant
  • Fin. No more data from sender
  • Psh. Push function
  • Rst. Reset the connection
  • Syn. Synchronize sequence numbers
  • Urg. Urgent Pointer field significant 

A flag appears as a single uppercase initial of the flagname. For example, the Fin flag appears as F, the single uppercase initial of the flagname.

AFP

tcpsyn

Displays the TCP sequence number in the packet.

1315819770

tcpack

Displays the TCP acknowledgment number in the packet.

0

tcpwin

Displays the TCP window size of the packet in bytes.

64240

icmptype

Displays a number that represents the Type field of the ICMP message.

8

icmpcode

Displays a number that represents the Code field of the ICMP message.

0

info

Displays an information entry that depends on the type of action that occurred. For example, an INFO-EVENTS-LOST action creates an entry for the number of events that occurred but were not recorded in the log since the time of the last occurrence of this event type.

23

noteNote
A hyphen (-) is used for fields where no information is available for an entry.


Create netstat and tasklist text files

You can create two custom log files, one to view network statistics (lists all listening ports) and the other to view the task list of either programs or services. The task list will provide the process identifier (PID) of the event which you can look up in the network statistics file for details. The procedure to create these two files is as follows:

To create network statistics and task list text files

  1. At the command prompt, type netstat -ano > netstat.txt, and then press ENTER.

  2. At the command prompt, type tasklist > tasklist.txt, and then press ENTER. If you want to create a text file for services rather than programs, at the command prompt, type tasklist /svc > tasklist.txt.

  3. Open the tasklist.txt and the netstat.txt files.

  4. In the tasklist.txt file, write down the Process Identifier (PID) for the process you are troubleshooting. Compare the PID with that in the Netstat.txt file. Write down the protocol that is used. The information about the protocol used can be useful when reviewing the information in the firewall log file.

Sample output of Tasklist.txt and Netstat.txt

Netstat.txt

Proto Local Address Foreign Address State PID

TCP 0.0.0.0:XXX 0.0.0.0:0 LISTENING 122

TCP 0.0.0.0:XXXXX 0.0.0.0:0 LISTENING 322

Tasklist.txt

Image Name PID Session Name Session# Mem Usage

==================== ======== ================ =========== ============

svchost.exe 122 Services 0 7,172 K

XzzRpc.exe 322 Services 0 5,104 K

noteNote
The actual IP addresses have been changed to (X), and RPC service to (z).


Verifying that Key Firewall and IPsec Services are Working

Updated: February 18, 2010

Applies To: Windows 7, Windows Server 2008 R2

For Windows Firewall with Advanced Security to operate correctly, the following services must be started:

  • Base Filtering Engine
  • Group Policy Client
  • IKE and AuthIP IPsec Keying Modules
  • IP Helper
  • IPsec Policy Agent
  • Network Location Awareness
  • Network List Service
  • Windows Firewall

To open the Services snap-in and verify that services are started

  1. Click Start and click Control Panel.

  2. Click System and Maintenance.

  3. Scroll to and click Administrative Tools.

  4. Double-click Services.

  5. If the User Account Control dialog box appears, confirm that the action it displays is what you want, and then click Continue.

  6. Verify that the services listed above are started. If one or more of the services are not started, right-click the service name in the list, and then click Start.


Resetting the Defaults in Windows Firewall with Advanced Security

Updated: February 18, 2010

Applies To: Windows 7, Windows Server 2008 R2

As a last resort, you may want to restore Windows Firewall with Advanced Security defaults. When you restore default settings, you lose all settings, all firewall rules, and all IPsec connection security rules configured locally on the computer after Windows was installed. Group Policy applied rules and settings are not disturbed. The loss of locally defined rules might cause some programs to stop working that depend on certain rules or settings. Also, if you are remotely managing this computer, the connection is lost when you restore defaults.

Before resetting the Windows Firewall with Advanced Security defaults, make sure that you save the current firewall state. This allows you to restore your settings if necessary.

The steps to save the firewall state and reset Windows Firewall with Advanced Security to its default configuration are as follows:

To save the current firewall state

  1. In the Windows Firewall with Advanced Security MMC snap-in, click Export Policy in the Actions pane.

  2. In the Save As property sheet, provide a name and path for the export file.

  3. Click Save.

noteNote
You can use the Import Policy option in the Actions pane to reapply your saved configuration.


To restore Windows Firewall with Advanced Security to its default configuration

  1. In the Windows Firewall with Advanced Security snap-in, click Restore Defaults in the Actions pane.

  2. At the Windows Firewall with Advanced Security prompt, click Yes to restore firewall defaults.


Capturing Firewall and IPsec Events with Netsh WFP

Updated: February 18, 2010

Applies To: Windows 7, Windows Server 2008 R2

Windows 7 and Windows Server 2008 R2 introduce the new netsh wfp context that enables you to capture diagnostic trace sessions of the behavior of the Windows Filtering Platform which is the base engine that implements your firewall and connection security rules. Starting a capture session, reproducing the problem, and then stopping the capture results in a log that can help you or Microsoft Customer Support Services (CSS) troubleshoot connectivity problems on your computers.

To capture a Netsh WFP diagnostics session

  1. Open a command prompt with Administrator permissions.

  2. At the command prompt, change the current folder to your desktop by running the command: cd %userprofile%\desktop

  3. To start the capture, run the command netsh wfp capture start.

  4. Reproduce the networking problem whose cause you are trying to diagnose.

  5. To complete the capture, run the command netsh wfp capture stop. The output file is stored in the current folder.

To view the WFP diagnostic data

  1. In Explorer, double-click the .cab file that you created in the previous procedure.

  2. The .cab file contains an .xml file and an .etl file. The .etl file is a binary file that is intended for use by CSS. The .xml file can be loaded and read locally. Because of the size of the .xml files produced by this process we recommend that you acquire an XML Reader program, instead of using a Web browser or Notepad to open the file. Several good ones are available for free download on the Web.

  3. Drag the wfpdiag.xml file from the .cab file to the desktop.

  4. Open the file with your XML reader of choice and examine the contents. Note the main sections:

    • sysInfo – This section contains information about the computer on which the trace was captured.
    • initialState – This section contains information about the state of the WFP and the currently configured rules before the problem was reproduced.
    • Events – This section contains information about things that occurred while the capture session was running.
    • finalState – This section contains the same information as initialState, but was captured when you ran the wfp capture stop command. You can directly compare the two sections to look for differences that might relate to the connection problem you are trying to diagnose.

Similarly, you can use the netsh trace and netsh trace stop commands to capture a variety of diagnostic information customized to a selected scenario, such as wfp-ipsec.

To capture a Netsh Trace diagnostics section

  1. At an Administrator: Command Prompt, run the command netsh trace start scenario=wfp-ipsec tracefile=%userprofile%\desktop\SampleTrace.cab

    Substitute a path a filename appropriate to your environment.

  2. The output of the command shows you that the trace is running, the file to which the data is written, and details of other possible parameters.

  3. Reproduce the problem whose cause you are trying to diagnose.

  4. run the command netsh trace stop.

    The computer takes a few moments to compile the collected trace data into a .cab file at your specified location.

  5. Open Windows Explorer, browse to the folder you specified, and double-click the .cab file, and examine its contents. A variety of text files, .xml files, event log files, and other types are included.


Also read:

Common Troubleshooting Situations using Windows Firewall with Advanced Security

Windows Firewall with Advanced Security Event Messages 

Enable IPsec and Windows Firewall Audit Events


Tools and Procedures Used to Troubleshoot Windows Firewall


Tools and Procedures Used to Troubleshoot Windows Firewall


Applies To: Windows 7, Windows Server 2008, Windows Server 2008 R2, Windows Vista

Using Monitoring in Windows Firewall with Advanced Security

Updated: December 6, 2011

Applies To: Windows 7, Windows Server 2008 R2

The first step you typically take in troubleshooting a Windows Firewall or IPsec problem is to view which rules are currently being applied to the computer. Using the Monitoring node in Windows Firewall with Advanced Security enables you to see the rules currently being applied both locally and by Group Policy.

  1. In the Windows Firewall with Advanced Security MMC snap-in, in the navigation tree, select and then expand Monitoring.

  2. In the navigation tree, select Firewall to view the currently active inbound and outbound rules. You can double-click a rule to view its details.

  3. In the navigation tree, select Connection Security Rules to view the currently active connection security rules that implement IPsec requirements on network traffic. You can double-click a rule to view its details.

  4. For either Firewall or Connection Security Rules, you can determine where a rule came from. In the Actions pane, clickView, and then click Add/Remove Columns. In the Available columns list, select Rule Source, click Add, position it in theDisplayed columns list by clicking Move Up or Move Down, and then click OK. It can take a few seconds for the list to appear with the new information.

  5. In the navigation tree, expand Security Associations, and then select either Main Mode or Quick Mode to view the currently active security associations that are established between the local computer and various remote computers.

  • Only one firewall rule is used to determine if a network packet is allowed or dropped. If the network packet matches multiple rules, then the rule that is used is selected using the following precedence:
    • Rules that specify the action Allow if Secure and also the option Block Override
    • Rules that specify the action Block
    • Rules that specify the action Allow
  • Only currently active rules are displayed in the Monitoring node. Rules might not appear in the list if:
    • The rule is disabled.
    • If the default inbound or outbound firewall behavior is configured to allow traffic that is not blocked by a rule, then allow rules of the specified direction are not displayed.
  • By default, the firewall rules in the groups identified in the following list are enabled. Additional rules might be enabled when you install certain Windows Features or programs.
    • Core Networking – all profiles
    • Remote Assistance – DCOM and RA Server TCP rules for domain profile only, other rules for both domain and private profiles
    • Network Discovery – private profile only

Viewing Firewall and IPsec Events in Event Viewer

Updated: February 18, 2010

Applies To: Windows 7, Windows Server 2008 R2

noteNote
This topic applies to computers that are running Windows 7 and Windows Server 2008 R2 only. To view firewall and IPsec events on computers that are running previous versions of Windows, see Enabling Audit Events for Windows Firewall with Advanced Security


Windows 7 and Windows Server 2008 R2 automatically log significant firewall and IPsec events in the computer’s event log. You can view events in the log by using Event Viewer.

To view events for Windows Firewall with Advanced Security in Event Viewer

  1. Event Viewer is available as part of Computer Management. Click Start, right-click Computer, and then click Manage. UnderSystem Tools, click Event Viewer.

  2. In the navigation tree, expand Event Viewer, expand Applications and Services, expand Microsoft, expand Windows, and then expand Windows Firewall with Advanced Security.

  3. There are four views of operational events provided:

    • ConnectionSecurity. This log maintains events that relate to the configuration of IPsec rules and settings. For example, when a connection security rule is added or removed or the settings of IPsec are modified, an event is added here.
    • ConnectionSecurityVerbose. This log maintains events that relate to the operational state of the IPsec engine. For example, when a connection security rule become active or when crypto sets are added or removed, an event is added here. This log is disabled by default. To enable this log, right-click ConnectionSecurityVerbose, and then click Enable Log.
    • Firewall. This log maintains events that relate to the configuration of Windows Firewall. For example, when a rule is added, removed, or modified, or when a network interface changes its profile, an event is added here.
    • FirewallVerbose. This log maintains events that relate to the operational state of the firewall. For example, when a firewall rule become active, or when the settings of a profile are changed, an event is added here. This log is disabled by default. To enable this log, right-click FirewallVerbose, and then click Enable Log.
  4. Each event includes a General tab that summarizes the information contained in the event. For more information about an event, click Event Log Online Help to open a web page in the Windows Server Technical Library that contains detailed information and prescriptive guidance.

    The event also includes a Details tab that displays the raw data associated with the event. You can copy and paste the information in the Details tab by selecting the text (CTRL+A selects it all) and then pressing CTRL-C.


Enabling Audit Events for Windows Firewall with Advanced Security

Updated: February 18, 2010

Applies To: Windows 7, Windows Server 2008 R2

ImportantImportant
The information in this topic is useful mainly to computers that are running Microsoft® Windows Vista® and Windows Server® 2008. Although the audit events are available in Windows® 7 or Windows Server® 2008 R2, it is more effective to use the operational event logging supported by those versions of Windows. For more information, see Viewing Firewall and IPsec Events in Event Viewer.


By default, Windows Firewall with Advanced Security in Windows Vista and Windows Server 2008 does not log anything in the Event Viewer log. The events that can be logged by Windows Firewall with Advanced Security are called “audit” events, and must be enabled. Once enabled, the events generated by Windows Firewall with Advanced Security can be viewed in Event Viewer.

For more information about events that are generated by Windows Firewall with Advanced Security, see Event IDs Used by Windows Firewall with Advanced Security

Enable audit events for Windows Firewall with Advanced Security

To enable audit events, use auditpol.exe, a command-line tool that modifies audit polices of the local computer. You can use the auditpol command-line tool to enable or disable the various categories and subcategories of events and then view the events in the Event Viewer snap-in.

  • To get the list of event categories recognized by the auditpol tool, type the following at the command prompt: 

    auditpol.exe /list /category

  • To get the list of subcategories under a category (this example uses the category Policy Change), type the following at the command prompt:

    auditpol.exe /list /category:”Policy Change”

  • To set a category and a subcategory to enable, type the following at the command prompt:

    auditpol.exe /set /category:”CategoryName” /SubCategory:”SubcategoryName

An example of setting a category and subcategory to enable is:

auditpol.exe /set /category:”Policy Change” /subcategory:”MPSSVC rule-level Policy Change” /success:enable /failure:enable

The events generated by Windows Firewall with Advanced Security span several categories and subcategories. Consider creating a batch file with the auditpol commands that you want that you can use to enable and disable audit events as needed. The following table lists event categories and subcategories that are relevant to troubleshooting Windows Firewall with Advanced Security.


Category Subcategories

Policy Change

  • MPSSVC rule-level policy change
  • Filtering Platform policy change

Logon/Logoff

  • IPsec Main Mode
  • IPsec Quick Mode 
  • IPsec Extended Mode 

System

  • IPsec Driver
  • Other system events 

Object Access

  • Filtering Platform packet drop 
  • Filtering Platform connection 

When you change audit policy settings, for changes to take effect, you must either restart the computer or force a manual policy refresh. You can force a manual refresh by typing the following command at the command prompt:

gpupdate /force

After you are done troubleshooting, you can disable the events by changing the enable settings above to disable and rerunning the commands.

Viewing firewall and IPsec audit events in Event Viewer

Once the audit events are enabled, use Event Viewer to view the events in the Security event log.

To view firewall and IPsec audit events in Event Viewer

  1. Click Start, click Control Panel, click System and Maintenance (on Windows Vista and Windows Server 2008) or System and Security (on Windows 7 and Windows Server 2008 R2), and then under Administrative Tools click View event logs.

  2. In Event Viewer, expand Windows Logs and then click Security. In the details pane, you can view the security-related audit events. The list of logged events is displayed at the top of the details pane. Clicking an event in the list displays more detailed information in the bottom of the Details pane. The General tab gives a description of the event in friendly text. The Details tab gives you the option to view the details of the event in either Friendly View or XML View. If you need more information about an event, on the General tab, click Event Log Online Help.


Configuring Firewall Log Files

1 out of 6 rated this helpful – Rate this topic

Updated: February 18, 2010

Applies To: Windows 7, Windows Server 2008 R2

You can enable logging in Windows Firewall with Advanced Security to create a text file that contains information about which network connections the firewall allows and drops. You can create the following types of log files:

Configure the firewall log file for a profile

Before you can view firewall logs, you must configure Windows Firewall with Advanced Security to create log files.

To configure logging for a Windows Firewall with Advanced Security profile

  1. In the console tree of the Windows Firewall with Advanced Security snap-in, click Windows Firewall with Advanced Security, and then click Properties in the Actions pane.

  2. Click the tab of the profile for which you want to configure logging (Domain, Private, or Public), and then click Customize.

  3. Specify a name and location.

  4. Specify a log file size limit (Between 1 and 32767 Kbytes).

  5. Click Yes for Log dropped packets.

  6. Click Yes for Log successful connections and then click OK.


To view the firewall log file

Open Explorer to the path and filename you chose in the previous procedure, “To configure logging for a profile”. To access the firewall log, you must be an administrator of the local computer.Windows Firewall with Advanced Security

You can view the log file in Notepad or any program that can open a text file.


Interpreting the firewall log file

The following log information is collected. Some data in the log file applies to only certain protocols (TCP flags, ICMP type and code, etc.), and some data applies only to dropped packets (size).


Fields Description Example

Date

Displays the year, month, and day that the recorded transaction occurred. Dates are recorded in the format YYYY-MM-DD, where YYYY is the year, MM is the month, and DD is the day.

2006-3-27

Time

Displays the hour, minute, and second when the recorded transaction occurred. Times are recorded in the format: HH:MM:SS, where HH is the hour in 24-hour format, MM is the minute, and SS is the second.

21:36:59

Action

Indicates the operation that was observed by the firewall. The actions available to the firewall are OPEN, CLOSE, DROP, and INFO-EVENTS-LOST. An INFO-EVENTS-LOST action indicates the number of events that occurred but that were not recorded in the log.

OPEN

Protocol

Displays the protocol that was used for the communication. A protocol entry can also be a number for packets that are not using TCP, UDP, or ICMP.

TCP

src-ip

Displays the IP address of the sending computer.

XXX.XXX.X.XX

dst-ip

Displays the IP address of the destination computer.

XXX.XXX.X.XX

src-port

Displays the source port number of the sending computer. A src-port entry is recorded in the form of a whole number, between 1 and 65,535. Only TCP and UDP display a valid src-port entry. All other protocols display a src-port entry of -.

4039

dst-port

Displays the port number of the destination computer. A dst-port entry is recorded in the form of a whole number, between 1 and 65,535. Only TCP and UDP display a valid dst-port entry. All other protocols display a dst-port entry of -.

53

size

Displays the packet size in bytes.

tcpflags

Displays the TCP control flags that are found in the TCP header of an IP packet:

  • Ack. Acknowledgment field significant
  • Fin. No more data from sender
  • Psh. Push function
  • Rst. Reset the connection
  • Syn. Synchronize sequence numbers
  • Urg. Urgent Pointer field significant 

A flag appears as a single uppercase initial of the flagname. For example, the Fin flag appears as F, the single uppercase initial of the flagname.

AFP

tcpsyn

Displays the TCP sequence number in the packet.

1315819770

tcpack

Displays the TCP acknowledgment number in the packet.

0

tcpwin

Displays the TCP window size of the packet in bytes.

64240

icmptype

Displays a number that represents the Type field of the ICMP message.

8

icmpcode

Displays a number that represents the Code field of the ICMP message.

0

info

Displays an information entry that depends on the type of action that occurred. For example, an INFO-EVENTS-LOST action creates an entry for the number of events that occurred but were not recorded in the log since the time of the last occurrence of this event type.

23

noteNote
A hyphen (-) is used for fields where no information is available for an entry.


Create netstat and tasklist text files

You can create two custom log files, one to view network statistics (lists all listening ports) and the other to view the task list of either programs or services. The task list will provide the process identifier (PID) of the event which you can look up in the network statistics file for details. The procedure to create these two files is as follows:

To create network statistics and task list text files

  1. At the command prompt, type netstat -ano > netstat.txt, and then press ENTER.

  2. At the command prompt, type tasklist > tasklist.txt, and then press ENTER. If you want to create a text file for services rather than programs, at the command prompt, type tasklist /svc > tasklist.txt.

  3. Open the tasklist.txt and the netstat.txt files.

  4. In the tasklist.txt file, write down the Process Identifier (PID) for the process you are troubleshooting. Compare the PID with that in the Netstat.txt file. Write down the protocol that is used. The information about the protocol used can be useful when reviewing the information in the firewall log file.

Sample output of Tasklist.txt and Netstat.txt

Netstat.txt

Proto Local Address Foreign Address State PID

TCP 0.0.0.0:XXX 0.0.0.0:0 LISTENING 122

TCP 0.0.0.0:XXXXX 0.0.0.0:0 LISTENING 322

Tasklist.txt

Image Name PID Session Name Session# Mem Usage

==================== ======== ================ =========== ============

svchost.exe 122 Services 0 7,172 K

XzzRpc.exe 322 Services 0 5,104 K

noteNote
The actual IP addresses have been changed to (X), and RPC service to (z).


Verifying that Key Firewall and IPsec Services are Working

Updated: February 18, 2010

Applies To: Windows 7, Windows Server 2008 R2

For Windows Firewall with Advanced Security to operate correctly, the following services must be started:

  • Base Filtering Engine
  • Group Policy Client
  • IKE and AuthIP IPsec Keying Modules
  • IP Helper
  • IPsec Policy Agent
  • Network Location Awareness
  • Network List Service
  • Windows Firewall

To open the Services snap-in and verify that services are started

  1. Click Start and click Control Panel.

  2. Click System and Maintenance.

  3. Scroll to and click Administrative Tools.

  4. Double-click Services.

  5. If the User Account Control dialog box appears, confirm that the action it displays is what you want, and then click Continue.

  6. Verify that the services listed above are started. If one or more of the services are not started, right-click the service name in the list, and then click Start.


Resetting the Defaults in Windows Firewall with Advanced Security

Updated: February 18, 2010

Applies To: Windows 7, Windows Server 2008 R2

As a last resort, you may want to restore Windows Firewall with Advanced Security defaults. When you restore default settings, you lose all settings, all firewall rules, and all IPsec connection security rules configured locally on the computer after Windows was installed. Group Policy applied rules and settings are not disturbed. The loss of locally defined rules might cause some programs to stop working that depend on certain rules or settings. Also, if you are remotely managing this computer, the connection is lost when you restore defaults.

Before resetting the Windows Firewall with Advanced Security defaults, make sure that you save the current firewall state. This allows you to restore your settings if necessary.

The steps to save the firewall state and reset Windows Firewall with Advanced Security to its default configuration are as follows:

To save the current firewall state

  1. In the Windows Firewall with Advanced Security MMC snap-in, click Export Policy in the Actions pane.

  2. In the Save As property sheet, provide a name and path for the export file.

  3. Click Save.

noteNote
You can use the Import Policy option in the Actions pane to reapply your saved configuration.


To restore Windows Firewall with Advanced Security to its default configuration

  1. In the Windows Firewall with Advanced Security snap-in, click Restore Defaults in the Actions pane.

  2. At the Windows Firewall with Advanced Security prompt, click Yes to restore firewall defaults.


Capturing Firewall and IPsec Events with Netsh WFP

Updated: February 18, 2010

Applies To: Windows 7, Windows Server 2008 R2

Windows 7 and Windows Server 2008 R2 introduce the new netsh wfp context that enables you to capture diagnostic trace sessions of the behavior of the Windows Filtering Platform which is the base engine that implements your firewall and connection security rules. Starting a capture session, reproducing the problem, and then stopping the capture results in a log that can help you or Microsoft Customer Support Services (CSS) troubleshoot connectivity problems on your computers.

To capture a Netsh WFP diagnostics session

  1. Open a command prompt with Administrator permissions.

  2. At the command prompt, change the current folder to your desktop by running the command: cd %userprofile%\desktop

  3. To start the capture, run the command netsh wfp capture start.

  4. Reproduce the networking problem whose cause you are trying to diagnose.

  5. To complete the capture, run the command netsh wfp capture stop. The output file is stored in the current folder.

To view the WFP diagnostic data

  1. In Explorer, double-click the .cab file that you created in the previous procedure.

  2. The .cab file contains an .xml file and an .etl file. The .etl file is a binary file that is intended for use by CSS. The .xml file can be loaded and read locally. Because of the size of the .xml files produced by this process we recommend that you acquire an XML Reader program, instead of using a Web browser or Notepad to open the file. Several good ones are available for free download on the Web.

  3. Drag the wfpdiag.xml file from the .cab file to the desktop.

  4. Open the file with your XML reader of choice and examine the contents. Note the main sections:

    • sysInfo – This section contains information about the computer on which the trace was captured.
    • initialState – This section contains information about the state of the WFP and the currently configured rules before the problem was reproduced.
    • Events – This section contains information about things that occurred while the capture session was running.
    • finalState – This section contains the same information as initialState, but was captured when you ran the wfp capture stop command. You can directly compare the two sections to look for differences that might relate to the connection problem you are trying to diagnose.

Similarly, you can use the netsh trace and netsh trace stop commands to capture a variety of diagnostic information customized to a selected scenario, such as wfp-ipsec.

To capture a Netsh Trace diagnostics section

  1. At an Administrator: Command Prompt, run the command netsh trace start scenario=wfp-ipsec tracefile=%userprofile%\desktop\SampleTrace.cab

    Substitute a path a filename appropriate to your environment.

  2. The output of the command shows you that the trace is running, the file to which the data is written, and details of other possible parameters.

  3. Reproduce the problem whose cause you are trying to diagnose.

  4. run the command netsh trace stop.

    The computer takes a few moments to compile the collected trace data into a .cab file at your specified location.

  5. Open Windows Explorer, browse to the folder you specified, and double-click the .cab file, and examine its contents. A variety of text files, .xml files, event log files, and other types are included.


Also read:

Common Troubleshooting Situations using Windows Firewall with Advanced Security


Memory leaks: Finding a memory leak in Microsoft Windows

Memory leaks: Finding a memory leak in Microsoft Windows

Brien M. Posey, Contributor

More on Computer Memory

Learn what do whenPerformance Monitor yields unexpected results.

Our topical resource center addresses computer memory related issues.

Before investing in server hardware, most companies spend a good deal of time researching the resources required to run the applications that the server will be hosting. But all this hard work can be undone by a poorly written application.

Over time, some applications can rob your server of resources far beyond any reasonable estimates. Applications withmemory leaks or applications that consume excessive amounts of processor time can not only kill server performance, but can also render that server unstable.

Memory issues with applications
Applications usually request memory from the OS in order to perform various functions. Under normal circumstances, an application will release memory once it has finished using it. A leaky application will request memory like any other application, but will not release the memory that is no longer needed.

The next time that the application runs the function that required the additional memory, the application will not use the memory that it is already consuming. In fact, it will request even more memory from the OS. The leaky app continues to hold onto this memory even after it is no longer needed. Over time the leaky app will drain the OS of more and more memory.

Memory leaks are not always obvious. There is no dialog box in Microsoft Windows that says, “You have a memory leak.” It’s up to you to find memory leaks, and corrrect them. But how do you know if you’ve got one?

Symptoms of memory leaks 
The symptoms of a memory leak vary. They depend on the amount of memory the leaky app consumes each time the leaky code is executed, as well as how often the leaky code is executed. The frequency with which the system is rebooted also makes a difference, since memory is restored to the OS during a reboot.

Some memory leaks are barely noticeable. But if one becomes significant enough to start affecting the OS, you’ll see some telltale signs. Including:

  • The system gradually becomes slower. Sure, it’s normal for a system to slow down over time to some extent, due to disk fragmentation, the installation of bloated applications and the overhead associated with an increasing workload. What isn’t normal is for a system’s speed to be restored after a reboot, only to quickly begin slowing down again. This is often a sign of a memory leak (although it can also mean a malware infection).

  • Unexpected error messages indicating that various system services have stopped. Note: Again, these types of messages might be caused by malware infections or other types of system problems. If system services are shutting down unexpectedly, it is generally not a sign of a memory leak unless other symptoms are also occurring.

  • An error message indicating that Windows is either low on, or has run out of, virtual memory.Below is a typical sample of this type of error message, but the exact messsage will vary, depending upon the version of Windows your server is running.


 How to detect a memory leak in Microsoft Windows

  Introduction 
  Memory leaks: Finding a memory leak in Microsoft Windows 
  Finding memory leaks using Performance Monitor 
  Memory leaks: Determine an applications CPU consumption 

Finding memory leaks using Performance Monitor

Brien M. Posey, Contributor

If your server is currently experiencing symptoms of a memory leak, you may be wondering how you can distinguish a memory leak from other types of performance problems.

There is no obvious message displayed indicating that a server is running a leaky application. Locating a memory leak usually involves watching various Performance Monitor counters and interpreting the results.

In the real world, it can be hard to tell if an application “leaks” unless you have something to compare it to. Fortunately, a Microsoft utility called Leakyapp does one thing: Creates a memory leak. This tool can help you observe how Performance Monitor behaves in memory leak situations.

Note: The Leakyapp utility causes a fairly serious memory leak to occur. Therefore, Performance Monitor data collected in the real world may not always be as dramatic as what you would observe using Leakyapp. When you look for memory leaks on production systems using Performance Monitor, the signs of a memory leak can be subtle.

If you want to learn how Leakyapp works, try this  Leakyapp download, which consists of a 5.12 KB ZIP file.

Using Performance Monitor
Access Performance Monitor by entering the PERFMON command at the server’s Run prompt. When Performance Monitor opens, several counters (mechanisms that Performance Monitor uses to measure some individual aspect of the server’s performance) will already have been loaded. Click the X icon repeatedly until all default counters have been removed. You can now load new counters by clicking the + icon.

Individual counters are organized into performance objects, which are simply categories under which Performance Monitor counters are stored. From hereon, I will refer to individual counters in performance object/counter format. For example, Processor/% Processor Time refers to the % Processor Time counter found in the Processor performance object.

To detect a memory leak using Performance Monitor, monitor these counters:

  • The Memory/Available Bytes counter lets you view the total number of bytes of available memory. This value normally fluctuates, but if you have an application with the memory leak, it will decrease over time.

  • TheMemory/Committed Bytes counter will steadily rise if a memory leak is occurring, because as the number of available bytes of memory decreases, the number of committed bytes increases.

  • The Process/Private Bytes counter displays the number of bytes reserved exclusively for a specific process. If a memory leak is occurring, this value will tend to steadily rise.

  • The Process/Page File Bytes counter displays the size of the pagefile. Windows uses virtual memory (the pagefile) to supplement a machine’s physical memory. As a machine’s physical memory begins to fill up, pages of memory are moved to the pagefile. It is normal for the pagefile to be used even on machines with plenty of memory. But if the size of the pagefile steadily increases, that’s a good sign a memory leak is occurring.

  • I also want to mention the Process/Handle Count counter. Applications use handles to identify resources that they must access. If a memory leak is occurring, an application will often create additional handles to identify memory resources. So a rise in the handle count might indicate a memory leak. However, not all memory leaks will result in a rise in the handle count.


 How to detect a memory leak in Microsoft Windows

  Introduction
   Memory leaks: Finding a memory leak in Microsoft Windows
  Finding memory leaks using Performance Monitor
  Memory leaks: Determine an applications CPU consumption

Memory leaks: Determine an application’s CPU consumption

Brien M. Posey, Contributor

One of the most common symptoms of a memory leak is that as time goes on, the computer runs slower and slower. Its speed is restored with a reboot, but it soons begin degrading again.

However, a memory leak is not the only condition that can cause these symptoms. They can also be caused by malware or by a poorly written application that consumes an excessive amount of CPU time. How can you tell how much CPU time an application is consuming, and whether that CPU consumption is a problem?

Determining application CPU usage
Determining how much CPU time an individual application is using is simple. Just press CTRL+ALT+Delete, then click the Task Manager button. When Task Manager opens, theApplications tab will display a list of all the applications running on the server.

Windows won’t actually display the amount of CPU time that an individual application is using. This is because Windows looks at the amount of system resources consumed by a process rather than an application. An application is made up of one or more processes. To see how much CPU time a process is using, select the Process tab.

The bottom of the screen below shows the total number of processes running on the machine at the given moment, along with the total percentage of CPU resources in use. The main part of the screen displays each individual process along with the percentage of CPU time the process is currently consuming. This screen displays both system processes and processes related to user-mode applications. The last process listed is the System Idle Process, which isn’t a process at all; it refers to how much of the CPU’s processing power is going unused at the current moment.

Any one of these processes (with the possible exception of the System Idle process) can momentarily consume all of the system’s processing power (100% CPU utilization). However, this does not necessarily indicate a problem. The only way to really find out whether a process is consuming an excessive amount of CPU time is to watch the process over time, and look at the average amount of CPU time it’s using.

Tracking CPU usage across systems
Windows’ Performance Monitor is not designed to track the CPU usage of individual processes, but it can track CPU usage across the entire system. The Processor\%ProcessorTime counter displays the current CPU usage similar to the way Task Manager does. The difference? This counter allows you to view average CPU consumption in addition to current CPU consumption.

If average CPU consumption is consistently above 80%, that’s usually a problem.
,

 If average CPU consumption is consistently above 80%, that’s usually a problem. But looking at average CPU utilization isn’t enough. To determine if a process is having a detrimental effect on the CPU, you must know how the CPU is being used.

In some cases high processor utilization means that your system is struggling to keep up. In other situations, the CPU might have a high utilization value, but is actually working very efficiently. In these situations, a high utilization value is often caused by an access number of interrupts. Interrupts occur when drivers or operating system subcomponents need to access other hardware components, such as the hard disk.

Performance Monitor counters
There are several CPU-related Performance Monitor counters that you can watch to get a better idea of what’s going on with your server’s CPU. The System/Processor Queue Length counterdisplays the number of items that are waiting for the CPU to become available. If this queue regularly exceeds two items, the CPU is not performing adequately.

As I mentioned earlier, interrupts caused by hardware devices that need to access the CPU. TheProcessor/Interrupts/Second counter allows you to watch how many processor interrupts occur each second. The number of interrupts per second that are considered normal varies from server to server.

But if a hardware device is getting ready to fail, it will often generate an excessive number of interrupts. If the number of processor interrupts per second seems high compared to your other servers, and there does not appear to be enough activity to justify the spike it interrupts (such as disk access), it could be a sign that a hardware component is failing.

The Processor/% Interrupt Time counter shows you what percentage of time the CPU spends servicing hardware interrupts. Again, watch for spikes in an interrupt activity without a corresponding increase in system activity.

Of course our goal is to determine whether the amount of CPU time spent on a particular process is healthy. The Processor/% User Time counter shows the percentage of time the processor spends on user mode applications. Note: This counter only looks at non-idle CPU time. If this value is consistently high, it doesn’t necesarily mean your CPU is being overworked; it simply indicates that a disproportionate amount of the CPU’s resources are being spent on user mode processes as opposed to kernel mode processes or interrupts.

The Processor/% Privileged Time counter shows the percentage of non-idle CPU time being spent on kernel mode processes. If this value is disproportionately high, it either means that the user mode applications running on your server are not consuming much CPU resources, or that excessive interrupts are occurring and that a hardware component might be getting ready to fail.

Improving the CPU’s performance
It’s okay for an application to have disproportionately high CPU utilization so long as the system’sCPU utilization as a whole is not consistently above 80%. If that’s the case, you need to find out why. If you determine that the excessive CPU usage is related to the applications running on the server, it may be necessary to either upgrade the processor or to move some applications to a different server. Another option is to use processor affinity to assign each application to a specific processor.

Note: Applications with memory leaks can cause the CPU to work excessively. As a system’s available RAM decreases, the system relies increasingly on the pagefile. The more heavily the pagefile is used, the more time is spent swapping pages between physical and virtual memory.

This page-swapping process consumes both CPU time and disk time (which also consumes CPU time in the form of interrupts). If your system seems to the paging excessively, look for applications with memory leaks and correct them. If no memory leaks exist, try increasing the amount of RAM installed in the server. Doing so will often improve the CPU’s performance.


 How to detect a memory leak in Microsoft Windows

  Introduction
   Memory leaks: Finding a memory leak in Microsoft Windows
   Finding memory leaks using Performance Monitor
  Memory leaks: Determine an applications CPU consumption

Why do Windows servers hang?

Why do Windows servers hang?

Part 1 | Part 2 | Part 3

Troubleshooting a hung or nonresponsive Windows server can be a challenging endeavor. Simply hitting the reset button is no longer a tolerated option as more companies use these servers for business-critical operations. This three-part series will explore the reasons why a Windows server may hang and provide a cookbook approach to diagnosing the underlying issues with the Windows Kernel Debugger (Windbg).

Background

When Microsoft released the early versions of its server operating system (Windows NT 3.5x and NT4), there was no easy way to troubleshoot a hung server. Other mainstream operating systems, such as Digital Equipment Corp.’s VAX/VMS, offered ways to manually intervene by forcing a crash dump whereby the server’s state could be captured at the time of the hang. This dump could then be analyzed to determine why the server hung. The only option for early Windows platforms, however, was to reset the box.

As Windows servers became more predominant in the business world, hitting the reset button became unacceptable.

As Windows servers became more predominant in the business world, hitting the reset button became unacceptable. As a result, in Windows 2000 Server and later versions, it became possible to force a crash dump to assist with determining why the server hung. Microsoft introduced this feature in Knowledge Base article 244139. It allows a keystroke combination (right CTRL+SCROLL LOCK twice) to generate a crash dump on PS/2-type keyboards. Microsoft extended this feature in Windows Server 2003 with a hotfix to the Kbdhid.sys driver to accommodate USB-type keyboards.

Several other options now exist to force a crash dump. Microsoft provides the Windows Special Administrative Console (SAC) Crashdump command as part of Windows Emergency Management Services (EMS), which allows for “headless” servers with no local graphical console. Vendor-specific options also exist to force a crash dump including the HP Integrity server’s Management Processor TC (transfer of control) command, an NMI (non-maskable interrupt) button on some Integrity models, or the Integrated Lights Out (iLO) virtual NMI button. We’ll take a closer look at each of these options later in the series.

Why a server hangs

There are a variety of reasons why a server may hang, including both hardware and software issues. The most common hardware reason for a server hang is spurious interrupts by a failing device. For example, a network interface controller (NIC) may have a bad component or be attached to a bad cable causing false interrupts to occur. These interrupts occur at an elevated interrupt request level (IRQL) dominating the attention of the processor(s), leaving lower priority requests (user level) unanswered. As a result, the server appears to be hung.

Another example of a hardware-induced hang involves storage requests going unanswered. For example, consider a case where a disk drive fails, causing outstanding I/O requests to be queued up. Eventually, these pending requests trigger a cascading effect of user and system threads to hang, leading to a system-wide outage.

More often, however, server hangs are a result of software issues. These issues come in several flavors, including:

  • System resource depletion (e.g., out of memory pool) — The most common type of software hang, this typically is the result of a memory leak by a driver or kernel mode thread. Resource depletion can also result from exceeding architectural limits of paged and nonpaged memory pools (typically experienced on an x86 32-bit operating system).

  • Deadlock conditions — A deadlock occurs when contention exists for common resources between two or more threads. For example, a deadlock exists when one thread owns an exclusive lock on a resource that another thread wants, and that thread exclusively owns a resource that the initial thread wants.

  • Spinlock conditions — Spinlock hangs are similar to deadlocks, but involve contention for a spinlock that is used to synchronize access to data structures in a multi-processor environment. Other permutations of these conditions include a driver holding a lock while performing other activities for an extended period of time. Actual examples of deadlock and spinlock hangs will be provided later.

  • High-priority, compute-bound threads — A software hang can also occur if high-priority, compute-bound thread(s) are dominating the processors. Since the Windows operating system permits varying levels of thread priority, one or more threads may execute at a higher priority than typical user threads. The result is that applications and users at normal priority are starved for CPU time, causing a perceived software hang.

The big picture

So, as you can see, there are numerous reasons why a server may hang. To give you a better idea of what happens when you force a crash to generate a memory dump, and subsequently analyze the crash to determine what caused the hang, see Figure 1 below.

Starting on the left-hand side, you can see the server crashes or hangs. In the event of a crash, the server would generate a memory dump if the dumpfile and pagefile are properly configured (see Microsoft Knowledge Base articles 254649197379 and 889654).

In the event of a hang, manual intervention would be required to force a crash dump as previously described. In either case, the content of memory is written to the pagefile.sys before the server is rebooted. During the reboot, the pagefile.sys is written to the memory.dmp file. Finally, once the server has rebooted, you can use the Windows Kernel Debugger (Windbg) to analyze the memory dump using a symbol server (as documented in KB article 311503) to translate memory references to meaningful functions and variables.

Figure 1: Overview of memory dump process and analysis

Now that you have a better idea of why server hangs occur, the next article in this series will look at the preparation process for troubleshooting a hung Windows server.

TROUBLESHOOTING A HUNG WINDOWS SERVER
– Part 1: Why do servers hang?
– Part 2: Preparing to troubleshoot
– Part 3: Resolving the issue

Part 1 | Part 2 | Part 3

Previously in this series, we looked at some of the reasons why server hangs occur in a network. Now that you have a little background, let’s look at the preparation process for resolving the problem using a tool called the Windows Kernel Debugger, or Windbg.

Preparation

A forced crash dump may only be necessary if other means of troubleshooting prove unsuccessful.

When troubleshooting a hung Windows server, there are several things that need to be done up front to prepare for collecting data. A forced crash dump may only be necessary if other means of troubleshooting prove unsuccessful. The first thing administrators should always do is runMPS Reports to collect event logs and other pertinent information. Close examination of system and application event logs may reveal a pattern of particular entries occurring prior to each hang. If the problem starts with a slow down or performance issue, you should collect Perfmon data as described in Microsoft Knowledge Base article 248345.

Once you determine that a forced crash dump is necessary, update the appropriate registry entries per KB article 244139 or 927069 and reboot the server. Also, ensure you have properly configured the dump file type as previously mentioned in KB article 254649. Finally, be sure that your pagefile.sys is sufficiently sized to accommodate a memory dump and that you have enough free space on the disk where the memory.dmp will be located, per KB article 886429.

Installing Windbg and setting the symbol path

In addition to configuring the server to generate a memory dump, you have to install the Windows Kernel Debugger and establish the symbol path. Do that on a separate server from the one that you are troubleshooting. You can download the Windbg kit free from Microsoft, and the kind of kit you choose depends on the architecture you are installing it on: (x86 or x64/IA64). Each is capable of reading a dump from a different architecture (i.e., 32-bit Windbg can read a 64-bit dump and vice versa).

More server management
tips from Bruce

Why do Windows servers hang?

Microsoft tool simplifies Windows server cluster configuration

Validating Windows server clusters with ClusPrep

Once Windbg is installed, be sure to establish the symbol path as documented in KB article 311503. Setting up the symbol path allows the debugger to translate memory references to meaningful functions and variable names. This will allow you to look at a stack trace and determine what routines were executing at the time of the hang.

Once you have all this set up, you are ready to analyze a crash dump. Use the appropriate keystrokes, Web GUI, Management Processor TC command or NMI button to initiate the forced crash as previously described. Be sure to allow sufficient time for the contents of memory to write to the pagefile.sys. If you have trouble getting the crash dump created, be aware that there are several reasons why a crash dump may not be captured as expected (see KB article 130536).

Now you are ready to determine the cause of the server hang. In the final part of this series, I’ll explain how to use Windbg to analyze a forced crash as a means of resolving the problem.


TROUBLESHOOTING A HUNG WINDOWS SERVER
– Part 1: Why do servers hang?
– Part 2: Preparing to troubleshoot
– Part 3: Resolving the issue

Part 1 | Part 2 | Part 3

Previously in this series, we talked about why Windows server hangs occur and how to prepare to resolve the problem using a tool called the Windows Kernel Debugger, or Windbg. In this article, we’ll finish up by learning how to analyze the crash dump and fixing the issue.

After you have captured a forced crash dump, you are ready to begin using Windbg to determine what caused the hang. The following sections will explore the appropriate Windbg commands to use depending on the type of hang.

You can invoke Windbg two ways. One way is from the Windows Start menu:

Start | All Programs | Debugging Tools for Windows | Windbg

The other is from the DOS command prompt:

C:\ > windbg

In Windbg, use the File pulldown menu to select Open Crash Dump, specifying the location of the dumpfile. This can be accomplished in one step from the command prompt by using the –z option:

C:\> windbg –z memory.dmp

Be sure to watch out for any warnings from Windbg indicating a truncated or inconsistent set-bit count. Messages like this may indicate the dumpfile is corrupt or missing data:

WARNING: Dump file has been truncated. Data may be missing.WARNING: Dump file has inconsistent set-bit count. Data may be missing.

********************************************************************************
********************************************************************************
********************************************************************************

Windbg does a good job of pointing out problems with asterisks (*), so be sure to pay particular attention whenever you see them in the output. By default, the debugger output is displayed in the main window with a one-line command prompt at the bottom.

No matter what sort of hang your server has encountered, the first command that should be used in Windbg is this:

!analyze –v -hang

The !analyze command will perform a preliminary analysis of the dump and provide a “best guess” for what caused the crash. In the case of a forced dump, the analysis will typically point to the i8042prt.sys or kbdhid.sys driver because that is the driver that initiated the crash. You will also notice the bugcheck type is a 0xE2, indicating a manually initiated crash as seen in Figure 1.

Figure 1 (Click to enlarge)

In addition to providing a best guess for the cause of the crash, the !analyze command will also check for blocking locks and set the processor, process, thread and register context to the current ones at the time of the crash. Subsequent commands will use this context for their execution.

Once you have executed the !analyze command, the commands in Table 1 will help determine the footprint or circumstances that existed when the crash was forced. Be sure to focus on the current process, current thread, stack trace, virtual and physical memory usage, and locking information. We will take a closer look at these commands in subsequent sections.

Windbg commands for analyzing server hangs.

Command Description
!process Display current process information
!thread Display current thread information
!running –it Display currently executing threads on all CPUs
!vm Display virtual memory usage
!poolused Display paged and non-paged pool usage
!memusage Display physical memory usage
!locks Display kernel locks held
!stacks Display summary of threads, states and function
kv Display current threads stack trace

High-priority compute-bound threads

Identifying the current process (!process) and the current thread (!thread) can prove useful if the server hung because of a high-priority runaway, compute-bound thread. Use the !running –it command, as it will list all the currently executing threads across all the processors. Processes and threads can be assigned various levels of priorities that can preempt other processes and threads.

System resource depletion

If you suspect a system resource depletion caused the hang, use the !vm, !poolused and!memusage commands. These commands display the virtual and physical memory usage at the time of the hang. Be sure to watch for any asterisks flagged by Windbg as illustrated in Figure 2.

Figure 2 (Click to enlarge)

To determine if paged pool or non-paged pool has been depleted, compare the “usage” to the “maximum” value as circled in red above. If the usage is relatively close to the maximum value, then there is a high likelihood that pool depletion caused the hang. You would then use the!poolused command to focus in on which pool data structure was responsible. The !poolusedcommand has several flags to sort the paged or non-paged data structures according to their usage (see the online debugger help for more information on the command syntax and usage).

It is worth mentioning that pool statistics can also be acquired by several tools without the need for a memory dump. You can use Perfmon to collect general paged and non-paged performance statistics. Poolmon and Poolsnap are free tools from Microsoft that capture more granular specifics on the actual pool data structures. Finally, note that it is possible to tune paged pool on x86 servers by tweaking two registry values (PagedPoolSize and PoolUsageMaximum). For further details on tuning paged pool, check out Microsoft KB article 312362.

Deadlock and spinlock hangs

Use the !locks command if you suspect a deadlock hang. As explained earlier, a deadlock exists when one thread owns an exclusive lock on a resource that another thread wants, and that thread exclusively owns a resource that the initial thread wants. There are several variants of a deadlock scenario, but there must be waiter threads that stall as a result. In Figure 3, you can see a potential deadlock scenario where we have an exclusively owned lock on a resource that has numerous waiters.

You will notice under the list of threads for the resource that one has an asterisk next to it. This thread is the one that owns the exclusive lock for the resource. So, the question to be answered is, what is causing the owning thread to stall and not release the lock for the other waiters to acquire? Therefore, the next command to issue would be a !thread command on the owning thread to determine why it is stalled.

Figure 3 (Click to enlarge)

Figure 4 shows the output of a !thread command on the owner. It reveals that it is stalled waiting for an I/O request packet (IRP) to complete from the QAFilter.sys driver. This particular case is a known issue caused by a deadlock with the QAFilter driver documented in Microsoft KB article 906194. Note that QAFilter and NmSvFsf are not standard Microsoft drivers, so symbols are not available for them from the Microsoft symbol server.

Figure 4 (Click to enlarge)

A spinlock hang is very similar to a deadlock condition except that processors are involved instead of threads. A data structure called a spinlock is used to synchronize access to other data structures or a critical section. Only one processor can own a particular spinlock at a time. The other processors that want to acquire the spinlock will wait (or spin) until the spinlock is released. In a spinlock scenario, multiple processors all want to acquire the same spinlock at an elevated IRQL, causing a perceived system hang.

To troubleshoot a spinlock hang, examine each processor to determine what function is executing at the time. Use the ~# command — where # is the processor number (0, 1, 2 …) — to change context between processors. You will notice that the debugger’s kd prompt changes to reflect the processor number that currently has context.

Then use the !thread or kv command to determine the stack trace of the current thread to see what function was executing. In a true spinlock scenario, all processors except one will be executing a spinlock acquire function. Finally, to determine the culprit (driver) responsible for the spinlock condition, look down the stack trace for the last driver to call the spinlock acquire function. See Figure 5 for an example of a stack trace illustrating a spinlock hang initiated by the XYZDrv.sys driver.

Figure 5 (Click to enlarge)

Finally, the command !stacks is very useful to determine which threads are executing and the states of those threads (running, ready, blocked, etc.). In the example of the spinlock hang,!stacks was extremely useful in illustrating how threads currently running on the various processors were all trying to acquire spinlocks except for the current thread that was executing the bugcheck code. Figure 6 shows an example of the !stacks command and the pertinent output.

Figure 6 (Click to enlarge)

And there you have it. Troubleshooting non-responsive Windows servers can be very perplexing. Fortunately, the Windows operating system has matured over the years and now offers a variety of features and tools to help determine what causes servers to hang. By forcing a crash dump and using Windbg to analyze it, you can typically isolate the hang to a particular application or system resource. Plus, if the problem requires further analysis from Microsoft, you will have the memory dump they will need to troubleshoot the issue.


TROUBLESHOOTING A HUNG WINDOWS SERVER
– Part 1: Why do servers hang?
– Part 2: Preparing to troubleshoot
– Part 3: Resolving the issue

Troubleshooting your toughest Windows server crashes

Troubleshooting your toughest Windows server crashes.

Amazing article from TechRepublic..

Part 1 | Part 2 | Part 3

Crash, boom, bang! Your Windows server just experienced a Blue Screen of Death (BSOD) and your helpdesk is being flooded with calls. The server is rebooting, but this is the fourth crash you’ve encountered this week and users are becoming unruly. To top it off, you now face spending hours on the phone, being passed around the world, with each vendor pointing to the other as the culprit.

It’s time to take matters into your own hands. With a basic knowledge of crash dump analysis, and a few simple commands, you can determine which driver is involved. Then, by intelligently searching the Internet you can potentially locate a hotfix or workaround to resolve the crashes.

This three-part series will cover the tools and steps you’ll need to tackle some of the toughest Windows server outages.

To begin with, the diagram in Figure 1 provides an overview of what happens when a crash occurs. As you can see, when the server crashes it writes the contents of physical memory (RAM) to the pagefile on the system partition. On reboot, the pagefile is written to the memory.dmp file, which also resides on the system partition. Finally, after the server reboots, you can then use the Windows kernel debugger (WinDbg) with Microsoft’s symbol server to analyze the crash.

Figure 1 (click to enlarge)

Three main areas need to be addressed to facilitate your crash dump analysis. First, the server must be configured to generate a crash when an unexpected condition or exception occurs. Next, you need to download the Windows debugger from Microsoft and set up the symbol server path. Finally, use the debugger to analyze the crash with a few simple commands. Now, let’s take a closer look at each area.

Configuring the dump

To configure your server to generate a crash, use the Control Panel | System applet | Advanced tab | Startup | Recovery settings shown in Figure 2. You can choose from three types of memory dump files: small, kernel or complete. By default, Windows will produce a small, “mini-dump” file when the server crashes. This may sometimes contain enough debugging information, but typically a kernel memory dump file is required. In rare circumstances, it may be necessary to configure a complete memory dump to capture the required debugging information. Please seeMicrosoft KB article 254649 for additional information on configuring memory dump files.

Figure 2

Installing the Windows debugger

The next step is to install the Windows kernel debugger tool, which can be downloaded for free from Microsoft. There are three versions of the debugger (x86, x64 and IA64), depending on the architecture of the server where you plan to analyze the crash. Once WinDbg is installed, you must establish the symbol path to translate memory locations into meaningful references to functions or variables used by Windows. The typical symbol path used isSRV*c:\symbols*http://msdl.microsoft.com/download/symbols. See Microsoft KB 311503 for details on establishing your debugger’s symbol path.

Analyzing the crash

Now that you have configured the server to generate a memory dump and installed the debugger with the correct symbol path, you are ready to analyze a crash. There are two ways to start up the debugger: from the program group “Debugging Tools for Windows” or from the DOS prompt with the WinDbg command. From within the debugger, use the File pull-down menu to “Open crash dump…” and point the debugger to your dump file.

When the dump file loads, you will notice the debugger’s screen is divided into two regions: the output pane that occupies the majority of the window and the command prompt at the bottom. The first command to use is:

!analyze –v

This command will perform a preliminary analysis of the dump and provide you with a best guess as to which driver caused the crash. The first thing the command shows you is the bug check type (also known as a stop code) and the arguments. The bug check type is very important and should be included with your query when you search the Internet for possible causes and fixes. As we see in the following example, WinDbg displays the bug check type as an LM_SERVER_INTERNAL_ERROR (stop code 54). In this case, if you searched the Microsoft websitefor LM_SERVER_INTERNAL_ERROR, you would find the known issue and hotfix documented inMicrosoft KB 912947. Even the first argument matches the KB article.

3: kd> !analyze -v ***************************************************** *                Bugcheck Analysis                  * *****************************************************

LM_SERVER_INTERNAL_ERROR (54)
Arguments:
Arg1: 00361595
Arg2: e8aab501
Arg3: 00000000
Arg4: 00000000

The !analyze –v command goes on to list which driver caused the crash. In our example, WinDbg accurately calls out the srv.sys driver that caused the crash:

Probably caused by: srv.sys (srv!SrvVerifyDeviceStackSize+78 )

Several other useful commands provide more information about the crash, including:

  • !thread – lists the currently executing thread
  • kv – displays the stack trace indicating which drivers and functions were called
  • lm t n – displays the list of installed drivers and their dates

Finally, you should be aware that the Windows debugger’s online help is excellent. In particular, you can look up the stop code for the crash and use the online help to recommend how to troubleshoot the issue. To find the list of stop codes, go to the Help pull-down menu and select Contents | Debugging Techniques | Bug Checks (Blue Screens) | Bug Check Code Reference. Then scan down the list to locate your stop code.

Many people think debugging a crash is better left for those with Ph.D.’s, but with a basic understanding and a few simple commands, anyone can get a leg up on identifying what is contributing to or causing a server crash. It is likely that someone else out there has already experienced the same crash, so a thorough Internet search will probably lead to potential workarounds or patches for the issue.

Join Bruce in part two of his series where he discusses how to identify which print driver is causing your spooler to crash or hang.


TACKLING YOUR TOUGHEST WINDOWS SERVER OUTAGES
– Which driver crashed my server?
– Troubleshooting print spooler crashes
– Finding Windows memory leaks


Part 1 | Part 2 | Part 3

With the vast variety of printers and drivers on the market today, it’s a daunting task to determine which one caused your print spooler to crash or hang. Hundreds of users can be affected by a single rogue print driver that seldom leaves any clues as to the cause. This article will tackle how you can determine which print driver caused your spooler to crash.

Overview

The process of troubleshooting a print spooler crash is very similar to troubleshooting a system crash, as discussed in part one of this series. A print spooler, however, may not generate a crash dump on its own, so a tool called ADPlus is used to capture the memory dump. ADPlus is a VB script that can be downloaded for free from Microsoft as part of the Debugging Tools for Windows. Once you install the debugging tools, you will find ADPlus.vbs in the following folder:

Program Files\Debugging Tools for Windows

ADPlus can be used in two modes depending on whether your print spooler is hanging or crashing. In hang mode, ADPlus forces a process dump on an application, or in this case, a print spooler. The dump contains all of the threads associated with the process in addition to the various DLLs and print drivers involved. A few simple debugger commands allow you to determine which printer is being accessed by the spooler and its corresponding driver.

In crash mode, ADPlus will monitor a process and capture its memory dump when it experiences an unhandled condition. The main difference between the two modes is that crash mode must be established prior to the process terminating, whereas hang mode is used at the moment the process locks up. In either mode, only the process you are debugging is affected; the rest of the processes and the operating system continue without downtime.

Once a process dump is captured, you can then use the Windows Debugger (Windbg) to analyze the failure. As discussed in part one, the debugger can also be downloaded for free from Microsoft as part of the Debugging Tools for Windows.

In the following sections, we’ll take a closer look at the steps required to capture a spooler dump, determine which print driver is the culprit and ultimately repair the problem.

Crash mode

As mentioned above, ADPlus crash mode captures a process memory dump when your print spooler is intermittently terminating. Crash mode must be established prior to the problem that is causing the print spooler failure. The very first time you use ADPlus you must establish cscript as the default script interpreter. To accomplish this, open a command prompt and change your default to the Debugging Tools for Windows folder. Then execute the ADPlus.vbs script without any options:

C:\Program Files\Debugging Tools for Windows > ADPlus.vbs

You only need to perform this step once; you are then ready to use ADPlus to capture a spooler crash. Here we see the ADPlus syntax used to set up crash mode detection on the print spooler process:

Adplus –crash –pn spoolsv.exe

This command will attach the console debugger (cdb.exe) to the print spooler process and minimize the window. Once an unexpected condition is encountered, the debugger will produce a process memory dump and terminate the process. By default, the dump is written to a subfolder in the Debugging Tools for Windows folder. You can then use the Windows Kernel Debugger to analyze the resulting dump file.

Hang mode

In hang mode, use ADPlus to force a process memory dump when a print spooler either stops responding or becomes 100% compute-bound. This is evident when users complain that their jobs aren’t printing even though the spooler process still exists. After forcing the process memory dump, ADPlus hang mode will resume the process instead of terminating it like in crash mode. Here we see the ADPlus syntax used to force a process crash with hang mode:

Adplus –hang –pn spoolsv.exe

Analyzing the dump

Once the process dump file has been obtained, use the Windbg tool to analyze the print spooler failure. After installing Windbg, the first step to using the tool is to establish the debugger’s symbol path to point to the Microsoft Symbol Server. Next, open the crash dump file with Windbg using the File pull-down menu, Open Crash Dump…, and then issue the command:

!analyze –v

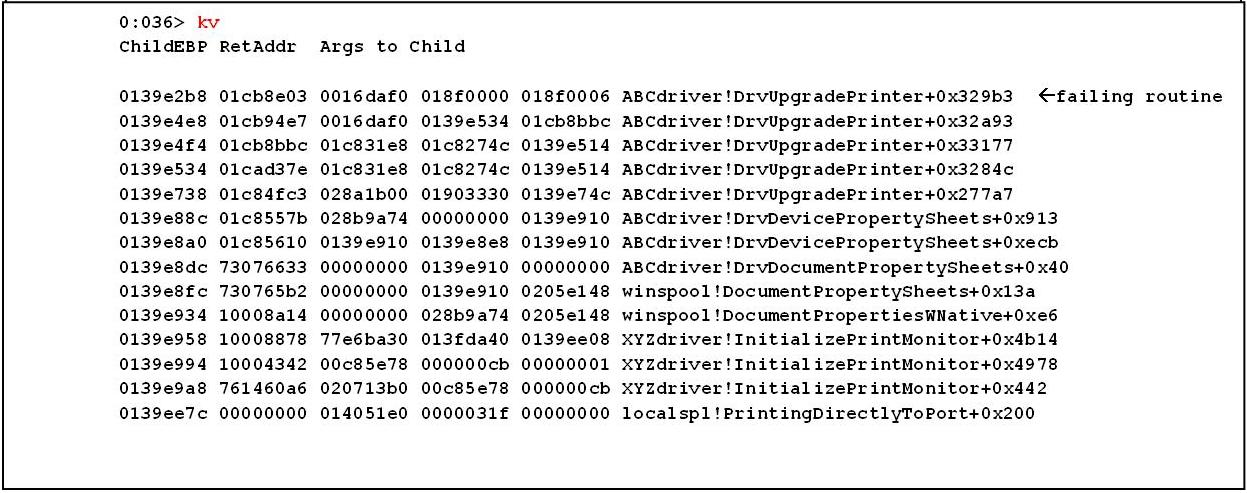
This command will perform a preliminary analysis of the dump and provide a best guess as to what caused the failure. The kv command will display the stack trace showing you which drivers or DLLs are involved. A stack trace is read from the bottom up so the top of the stack is the most recently executed function. In the following example, we see a stack trace illustrating a spooler failure caused by the ABCdriver:

Figure 1 (click to enlarge)

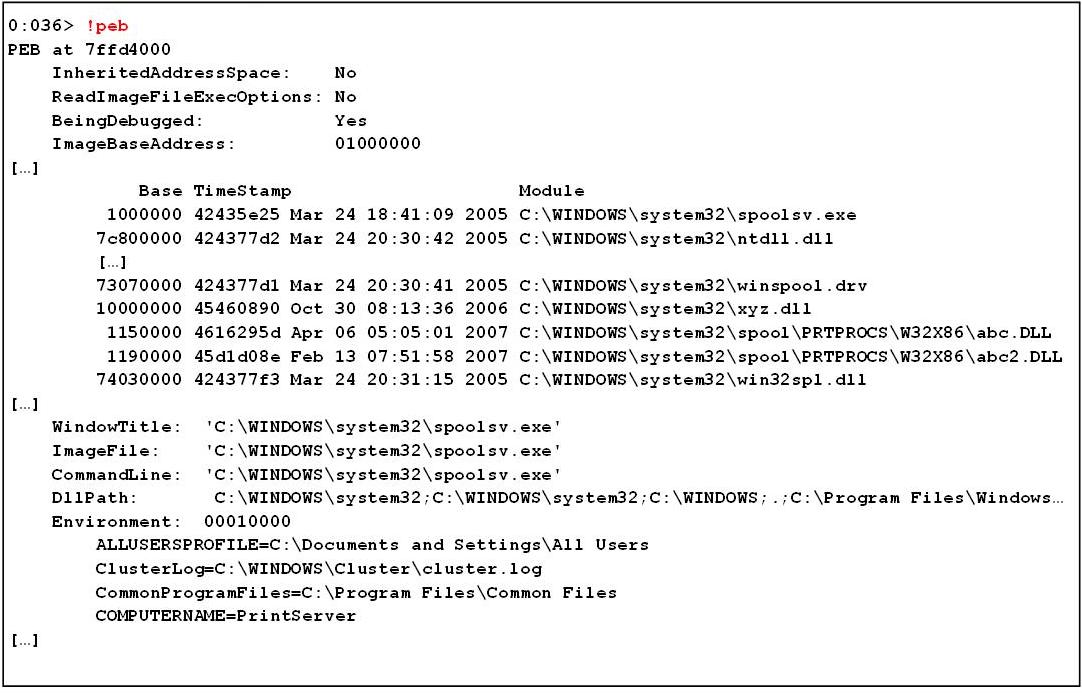
Another useful command is !peb, which allows you to see all of the drivers and DLLs associated with the print spooler process. The command displays the process environment block as we see in the following example. Much of the output has been omitted […] as it goes on for several pages:

Figure 2 (click to enlarge)

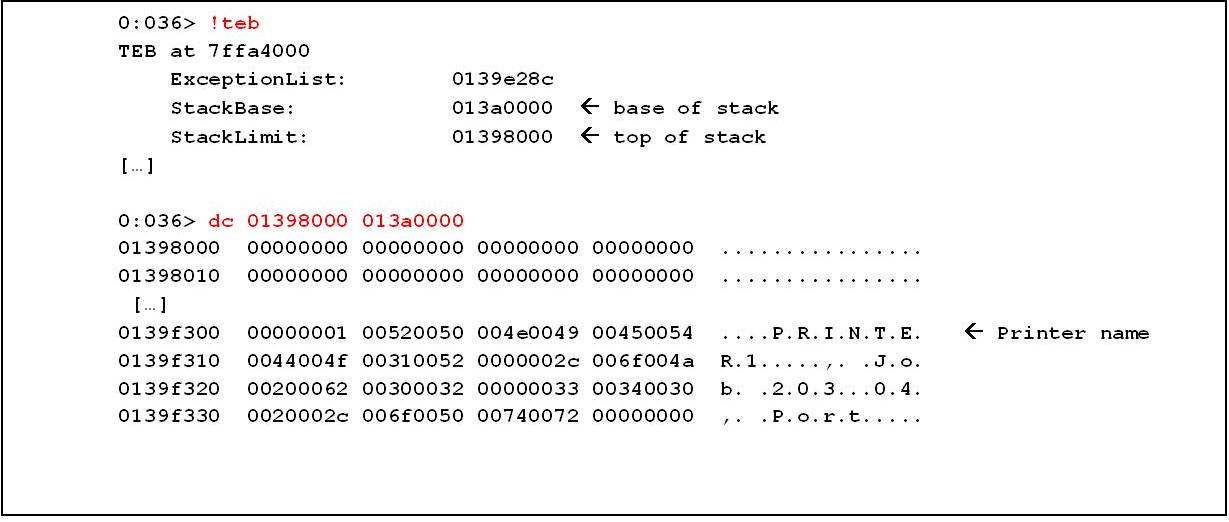
Finally, to determine the printer and job that is being accessed at the time of the failure, use the!teb command. That will display the thread environment block that provides the stack base and limit. You can then display the stack contents with the dc command to reveal the printer that is causing the problem. You will have to scroll through several pages of output, but you will eventually recognize the printer, job and port number in ASCII text to the right:

Figure 3 (click to enlarge)

In this case, the printer name is PRINTER1, the job number is 203, and the port number is 04. The stack contents also contain the associated driver name if you look closely. Once you know the printer and the driver, you can contact the appropriate vendor to determine if an updated driver is available that resolves your issue.

As you can see, troubleshooting a print spooler failure is straightforward once you become familiar with the tools. Starting with ADPlus to capture the dump, then using Windbg to analyze it, and finally leveraging the Web to intelligently search for similar crash footprints will lead you to your solution. Taking matters into your own hands will save you time, money and keep your users happy.

Join Bruce in part three of this series, where he will go over simple techniques for determining memory leaks.


TACKLING YOUR TOUGHEST WINDOWS SERVER OUTAGES
– Which driver crashed my server?
– Troubleshooting print spooler crashes
– Finding Windows memory leaks

Part 1 | Part 2 | Part 3

As we continue our series on tackling the toughest Windows server outages, the time has come to explore the different tools and techniques used to track down Windows memory leaks.

As you may know, memory leaks are caused by poorly written applications or drivers that allocate memory and then subsequently fail to de-allocate all of it. After time, this can lead to the depletion of system memory pools (paged or non-paged) causing the server to eventually hang.

Long before a Windows server hangs though, there are typically other symptoms of a memory leak. The main things to watch out for are entries in the system event log from the server service (SRV component). In particular, be on the lookout for:

Event ID 2019: The server was unable to allocate from the system nonpaged pool because the pool was empty

or

Event ID 2020: The server was unable to allocate from the system paged pool because the pool was empty

These two events are indicative of a Windows memory leak and need to be investigated immediately. Other signs of a memory leak include excessive pagefile utilization and diminishing available memory.

Perfmon

The first tool typically used to diagnose memory leaks is Perfmon, a graphical tool built into Windows. By collecting performance metrics on the appropriate counters, you can determine whether the memory leak is being caused by a user process (application) or a kernel mode driver. The performance metrics can be collected in the background with the counters being written to a log file. The log file can subsequently be read by Perfmon or the Performance Analysis of Logs (PAL) from CodePlex. Microsoft KB article 811237 explains how to setup Perfmon to log performance counters. There is also a free tool called PerfWiz from Microsoft which provides a wizard to help setup Perfmon logging.

If you suspect a user mode application is leaking memory, you can use Perfmon to collect the Process object counters, Pool Paged Bytes and Pool Nonpaged Bytes for all instances. This will display whether any processes continue to allocate paged or non-paged pool, without subsequently de-allocating it. If you suspect a kernel mode driver is leaking memory, use Perfmon to collect the Memory object counters, Pool Nonpaged Bytes and Pool Paged Bytes.

In the following example, Perfmon is being used to monitor performance counters for the memory object, namely paged and non-paged pool. By right-clicking each counter, you can adjust the scale to have both counters appear on the same graph. As you can see in Figure 1, the Pool Paged Bytes counter (red line) continues to grow without decreasing, meaning it is leaking memory. Looking at the minimum value for the paged pool counter, it appears it has gone from a value of 118 MB to a maximum value of over 350 MB.

Figure 1 (click to enlarge)

So at this point in our example, we know we have a paged pool leak. We can then use Perfmon to examine the Process object for Pool Paged Bytes. If no processes show a corresponding increase in paged pool usage, we can conclude that a driver or kernel mode code is leaking memory.

Poolmon

To further isolate the memory leak, we need to determine which driver is allocating the memory. When drivers allocate memory, they insert a four-character tag into the memory pool data structure to identify which driver allocated it. By examining the various pool allocations, you can determine which drivers are responsible for allocating how much pool. To associate which tags correspond to certain drivers, see Microsoft KB article 298102. You could also install theDebugging Tools for Windows and check the following file:

\Program Files\Debugging Tools for Windows\Triage\Pooltag.txt

The Memory Pool Monitor utility (Poolmon) is a free tool from Microsoft that will watch pool allocations and display the results illustrating the corresponding drivers. In the following example, Poolmon is being used to track the leaking pool tag “Leak” at the top of the list. Poolmon shows the number of allocations, number of frees, the difference, and the number of bytes allocated. Poolmon will also show the name of the driver if it is setup properly.

Here we can see the tag “Leak” belongs to the Notmyfault.sys driver and has over 83 MB of paged pool allocated.

Figure 2 (click to enlarge)

Windbg

If all else fails and your server locks up completely due to a memory leak, you can always force a crash dump and subsequently analyze it as discussed in my previous article on why Windows servers hang. The key things to look for when analyzing the crash with the Windows Kernel Debugger (Windbg) utility are the memory pool usage and which data structures are consuming the pool.

The first command to use in the debugger is !vm 1, as seen in the following example. This command will display the current virtual memory usage, in particular the non-paged and paged pool regions. The debugger will flag any excessive pool usage and any pool allocation failures as shown in Figure 3. The trick is to compare the usage with the maximum as highlighted in yellow below. If the usage is at or near the maximum, then the server hung because it ran out of pool.

Figure 3 (click to enlarge)

Finally, you can use the debugger to display the paged or non-paged pool data structures with the !poolused command. Various options on the command allow you to specify either paged or non-paged pool and sort the output. In the following example, the !poolused 5 command is used to display the paged pool data structures, sorted in descending order by usage. In Figure 4, you can see the pool structure with the tag “Leak” is consuming the most paged pool (over 115 MB) and is associated with the notmyfault.sys driver.

Figure 4 (click to enlarge)

As you can see, using tools such as Perfmon, PerfWiz, PAL, Poolmon and Windbg, you can monitor the memory leak, determine whether it is paged or non-paged memory, and discover what driver or application is responsible. After that, contacting the software vendor is usually the best option to see if they have an updated driver or image available that resolves the memory leak.


TACKLING YOUR TOUGHEST WINDOWS SERVER OUTAGES
– Which driver crashed my server?
– Troubleshooting print spooler crashes
– Finding Windows memory leaks

ABOUT THE AUTHOR
Bruce Mackenzie-Low, MCSE/MCSA, is a systems software engineer with HP providing third-level worldwide support on Microsoft Windows-based products including Clusters and Crash Dump Analysis. With more than 20 years of computing experience at Digital, Compaq and HP, Bruce is a well known resource for resolving highly complex problems involving clusters, SANs, networking and internals.

Troubleshooting a failed virtual machine conversion task

Conversions sometimes fail no matter how careful you are preparing the server. The failure can occur at various stages in the conversion process; these stages are based on the task bar percent and are estimated values.

1. Creation of the target virtual machine (VM) (0%-5%)
2. Preparing to Clone the Disk (5%-6%)
3. Cloning (6%-95%)
4. Post-cloning (95%-97%)
5. Customization/Reconfiguration (97%-99%)
6. Install Tools/Power On (99%-100%)

Converter creates a detailed log file during the conversion process which will contain exact errors pertaining to why the conversion failed. This log file is located on the server you are converting that is running the Converter agent, and is usually named vmware-converter-0.log and is located in the C:\Windows\temp\vmware-temp directory.